
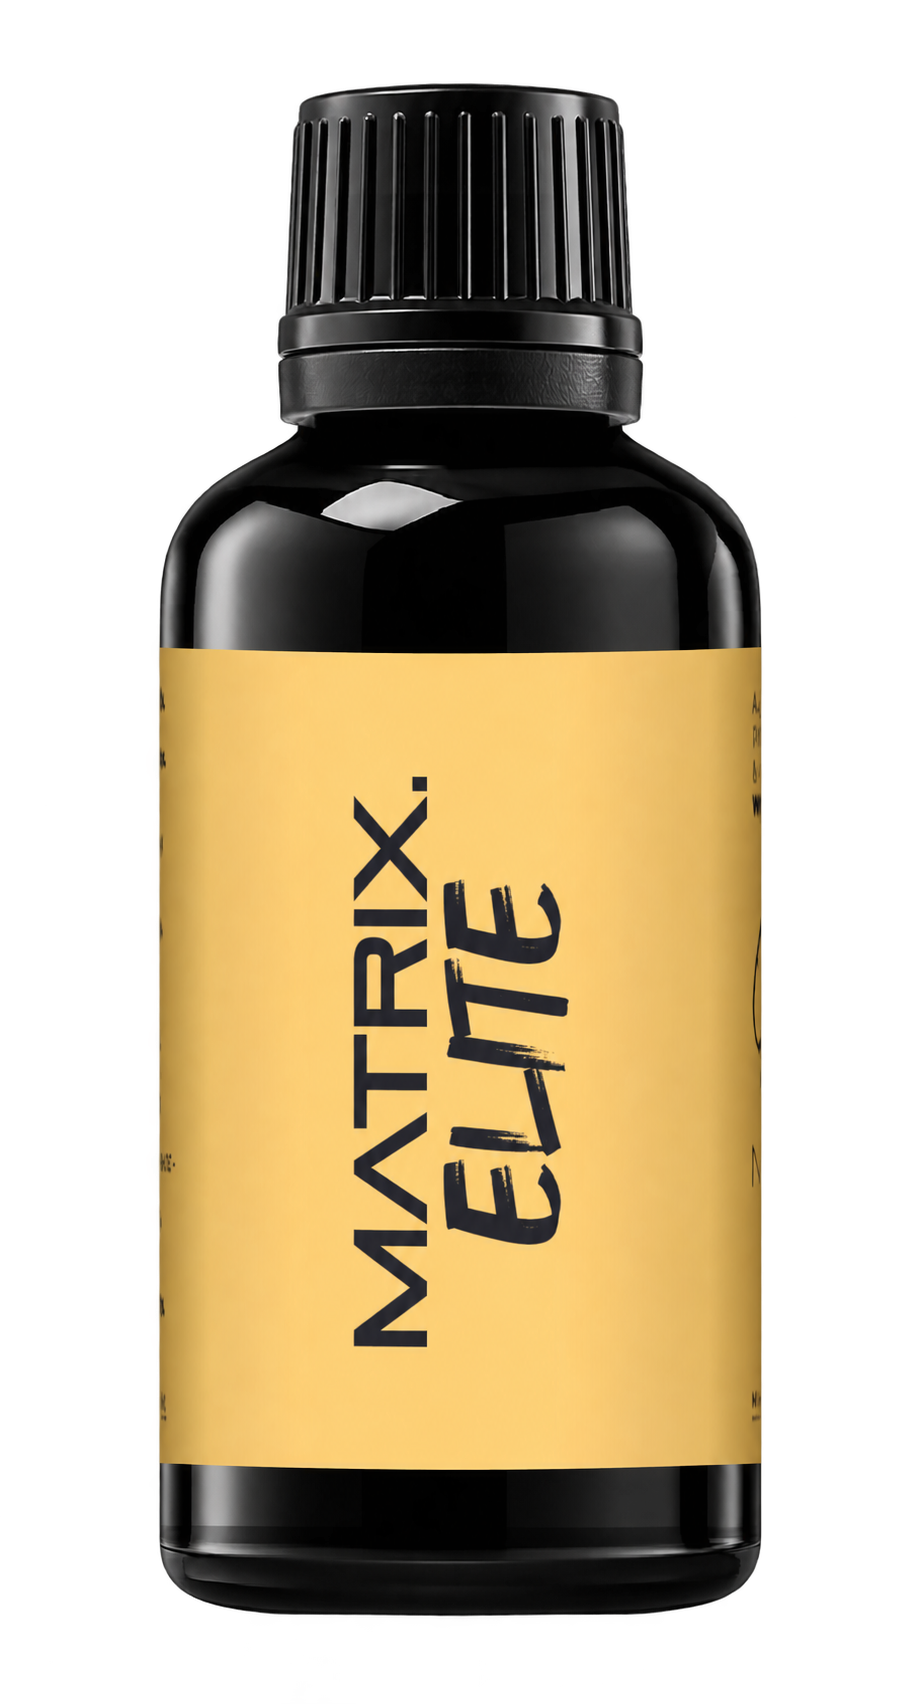
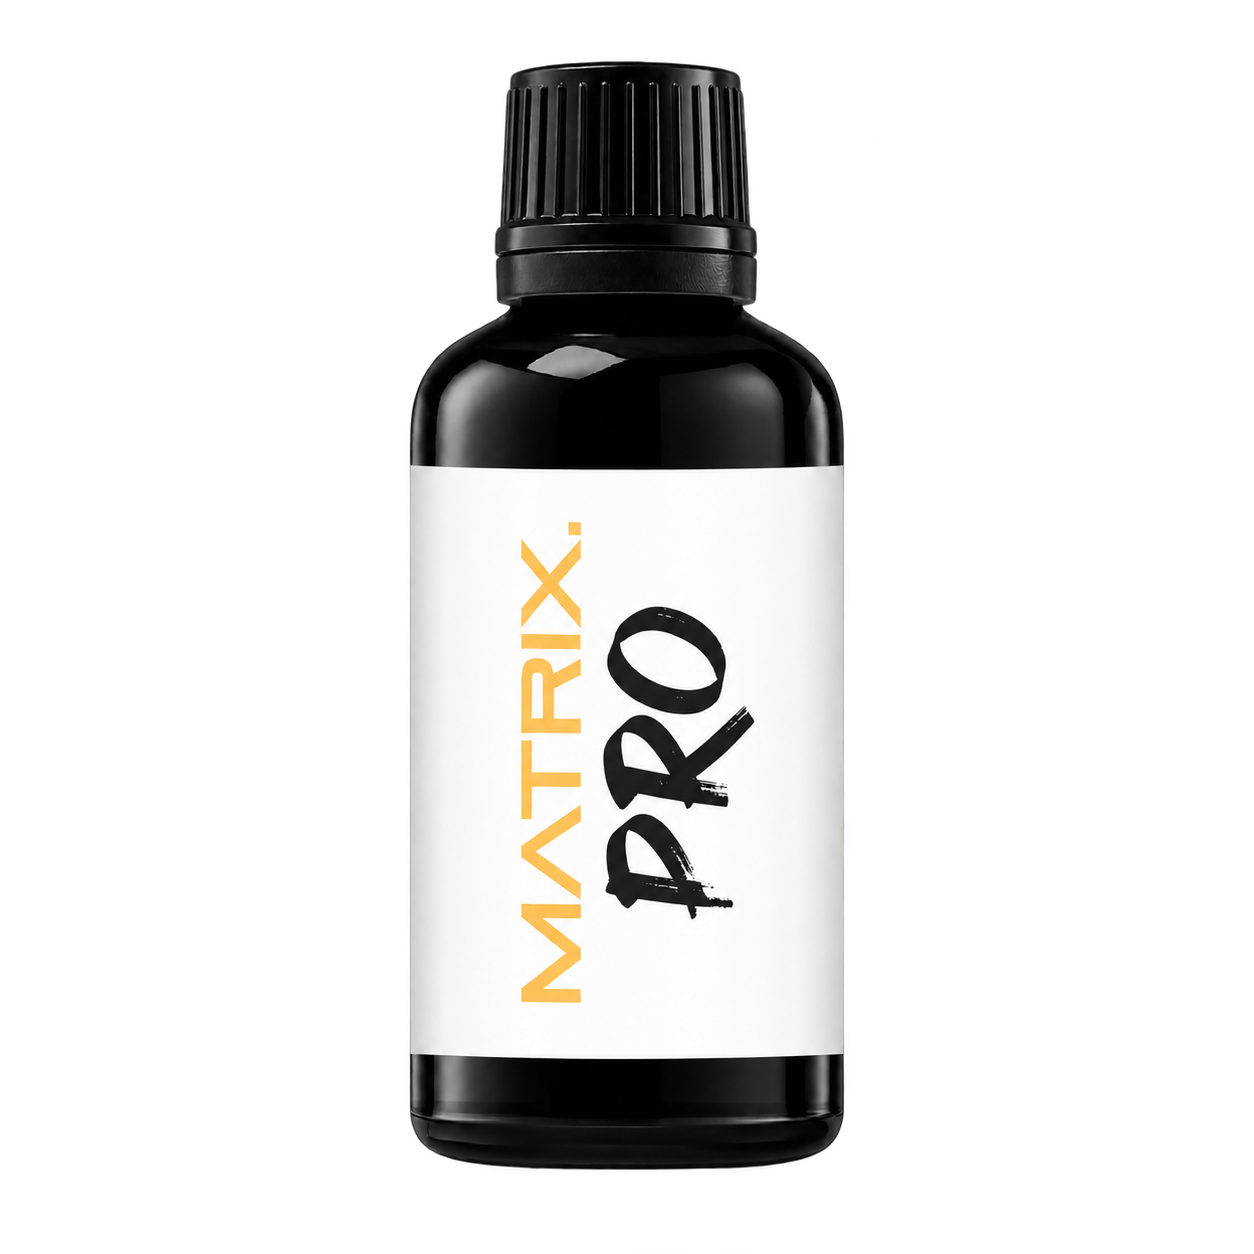
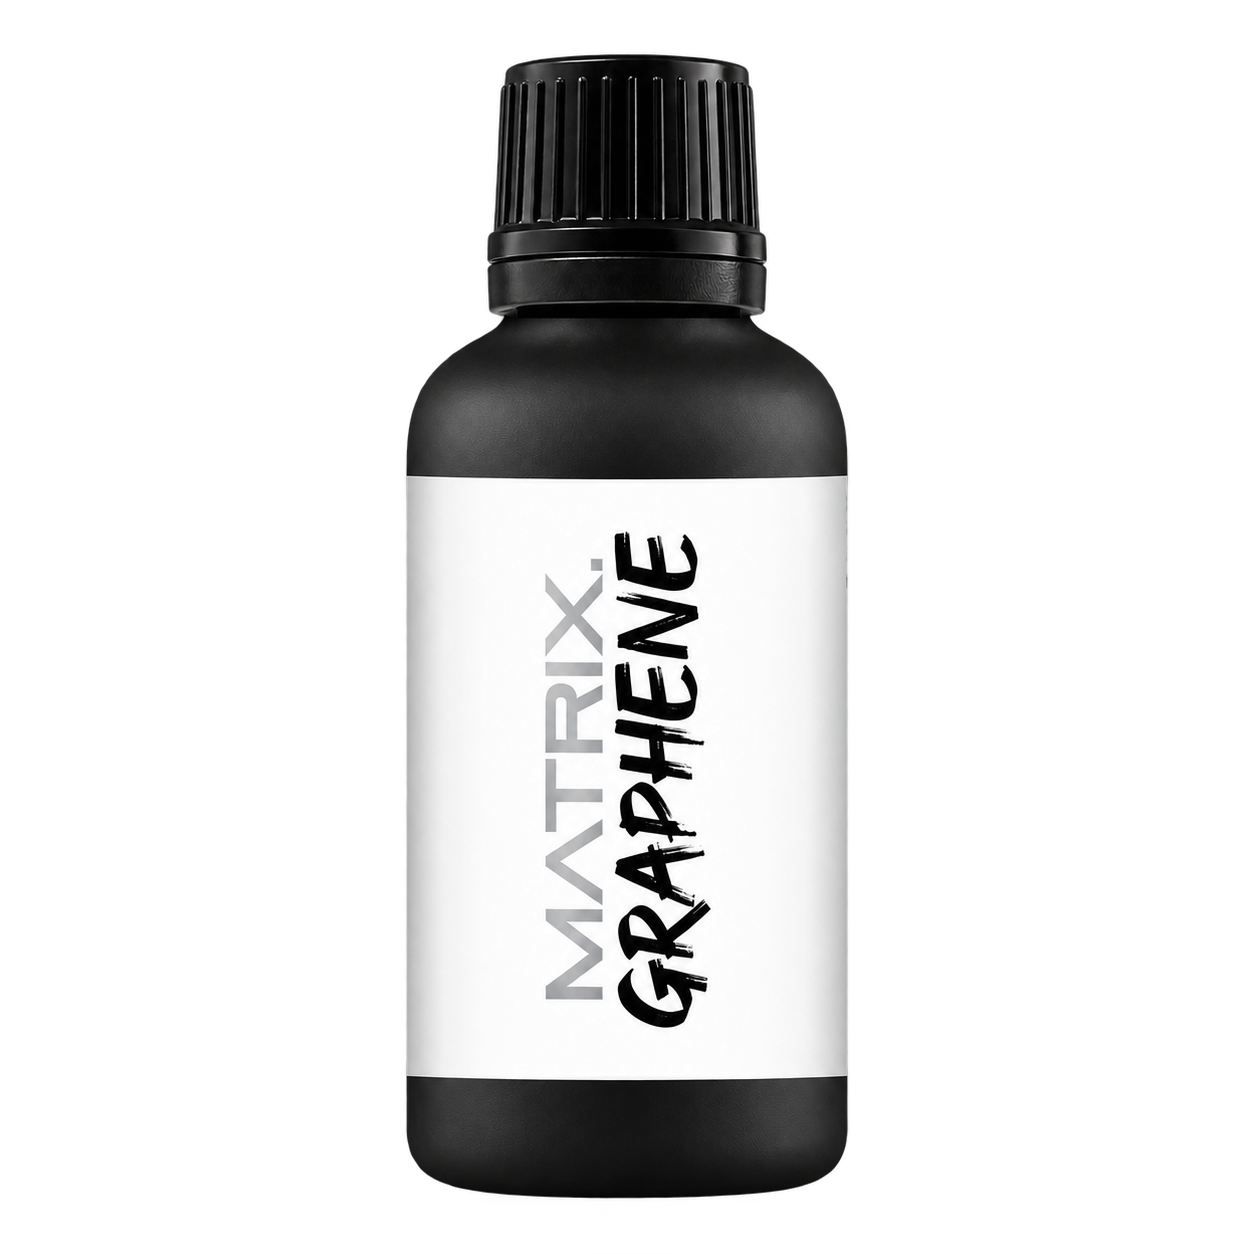
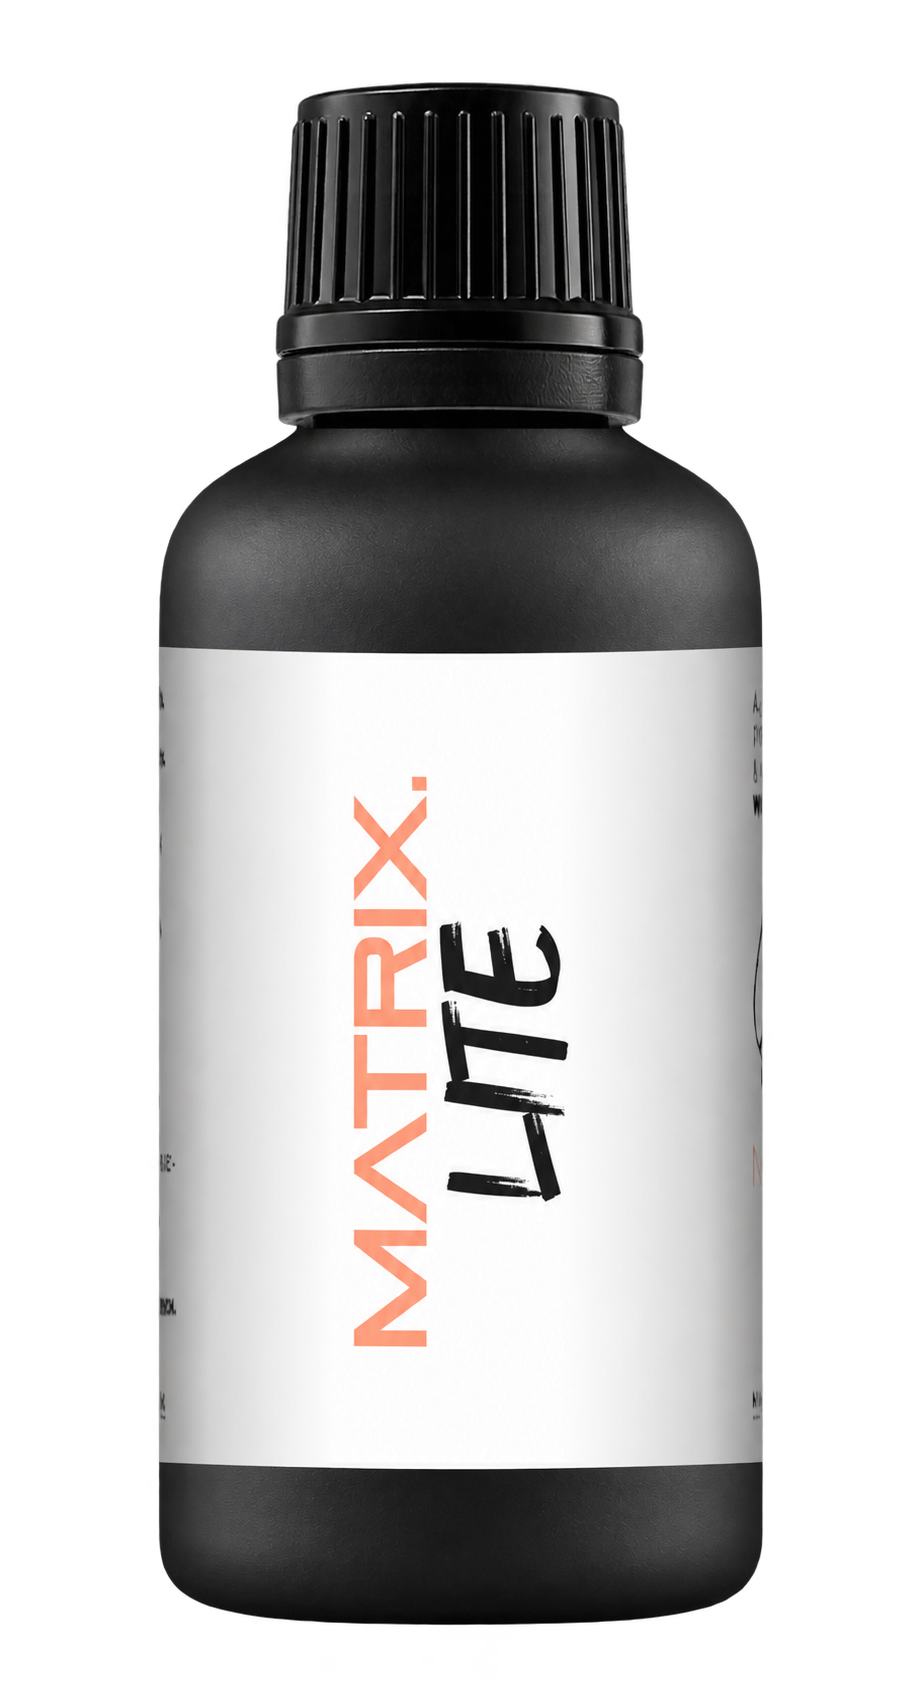


A full polishing range.
From cutting and one-step correction to final finishing.
Specialist chemistry. Expert application.
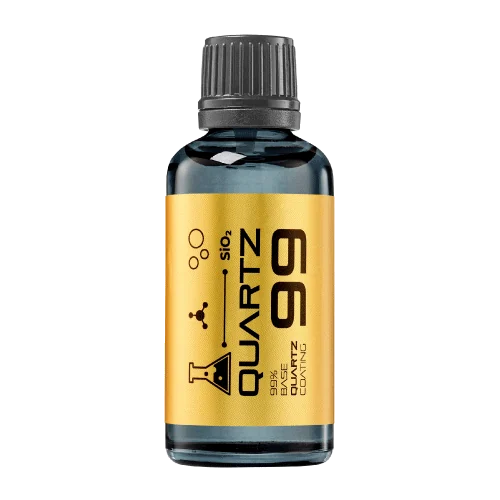 QUARTZ99 / CERAMIC BASE COAT
The foundation of your coating system.
A layerable quartz base coat designed for mechanical protection. Pair it with a suitable top coat to create the final finish.
For application by NANOLAB certified installers only.
Four formulas. Extended working time. Find the coating for your finish.
Explore the BEAST family of ceramic coatings.
Find the coating for each exterior surface.
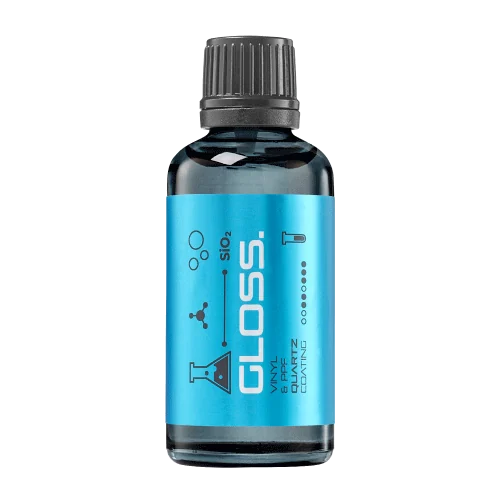 PPF & VINYLGLOSSProtection for glossy films and wraps.Discover
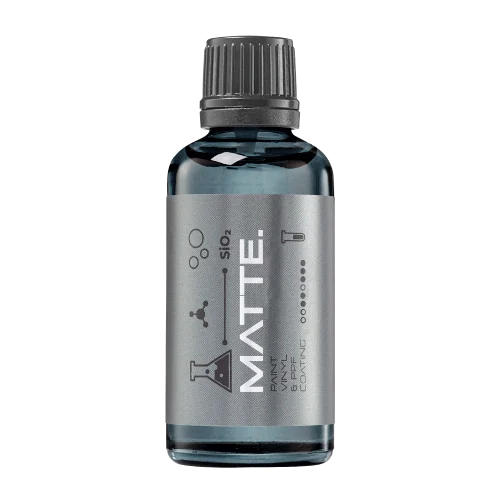 MATTE & SATINMATTEProtection that respects the finish.Discover
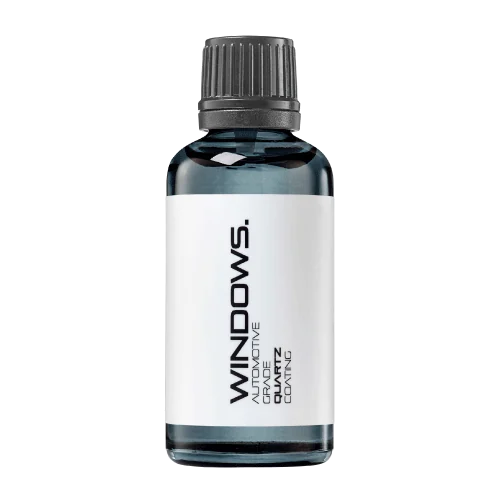 GLASSWINDOWSExplore dedicated glass protection.Discover
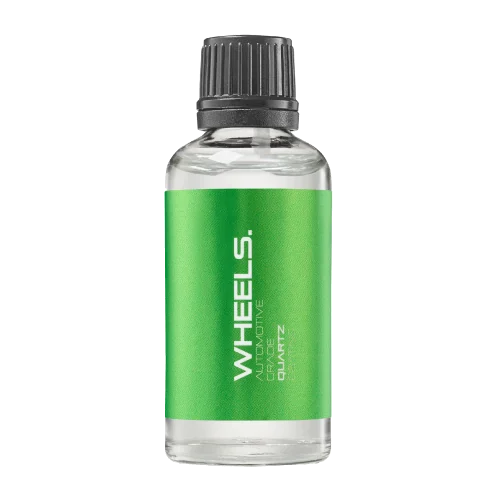 WHEEL PROTECTIONWHEELSA dedicated coating for your wheels.Discover
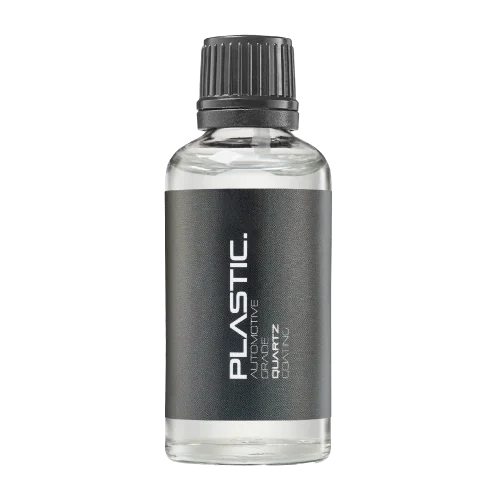 TRIM PROTECTIONPLASTICProtection for plastic surfaces.Discover
Dedicated care for the surfaces inside.
 LEATHER SURFACESLEATHERDiscover NANOLAB leather protection.Discover PLASTIC SURFACESPLASTICProtection for interior plastic surfaces.Discover TEXTILE SURFACESFABRICExplore the latest fabric formulation.Discover
Spray protection, maintenance and upcoming wash products.
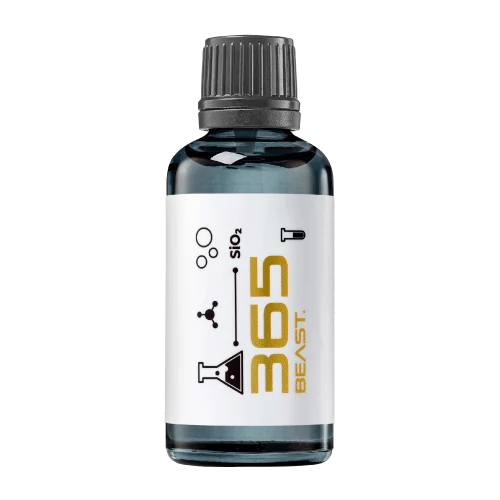 MAINTENANCEBEAST 365Explore the BEAST maintenance range.Discover
Next in washing, cleaning & care.
Ceramic protection for boats and yachts.
An easy-to-apply ceramic coating with an established track record on boats and yachts around the world.
Results vary with surface preparation, exposure and maintenance.
Read 50 MARINE guides →Explore MARINEProtection for the surfaces you live with.
A look at what we’re developing.
From cutting and one-step correction to final finishing.
A wider range for professional vehicle care.
Taking shape alongside BEAST & MATRIX.
Practical guidance for your next coating project.
Explore all guides →
Use a time-ordered run chart to investigate changes after an applicator replacement while keeping other process changes visible.
Updated · NANOLAB Knowledge

An applicator replacement may coincide with a change in coating consumption or finish quality. A run chart preserves the sequence of observations so the change can be examined instead of hidden inside a monthly average.
Examples include product use per accepted area or a repeatable appearance score. Keep the unit, inspection method and job basis consistent. Do not combine unrelated substrates into one series without identifying them.
Plot each observation in time order and mark when the applicator changed. Record other events such as a new operator, batch, preparation method or environmental shift. These may explain part of the apparent step.
| Pattern | Next review |
|---|---|
| Sustained level change | Check the intervention and concurrent changes |
| One isolated extreme | Investigate that job or measurement |
| Increasing spread | Review consistency and job mix |
A run chart is an investigative tool, not proof that the applicator caused the change. Use a planned comparison or other suitable evidence if causation matters. Formal run rules or control limits should be selected for the data and purpose rather than invented after viewing the pattern. Keep first-pass quality alongside consumption: using less product is not a process improvement if accepted output falls.
Ask NANOLAB about your surface and intended use. For application and care, use the current instructions for the exact product.
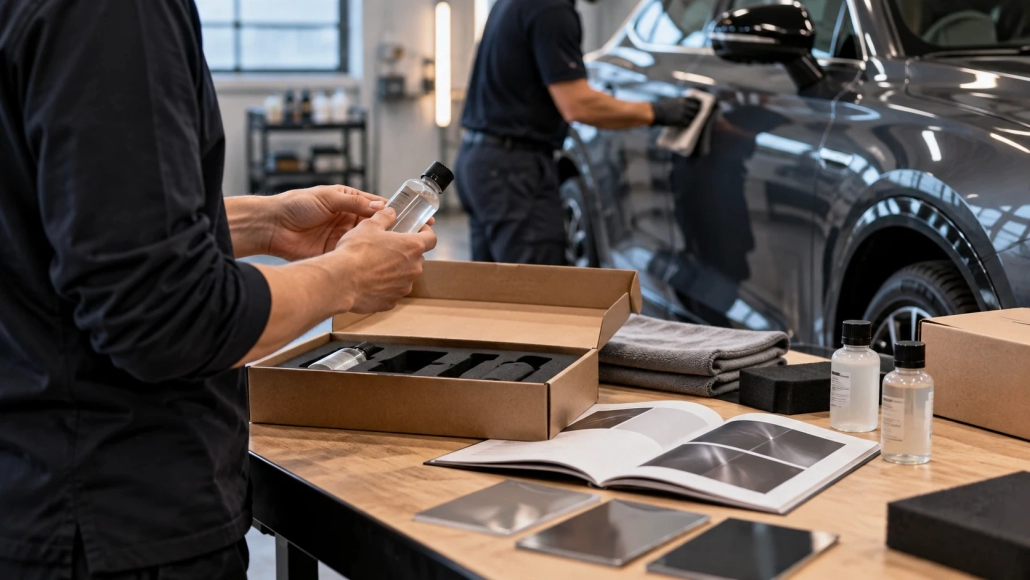
Design a coating field trial with recorded vehicles, use patterns, care routines and inspection points that produce interpretable feedback.

An applicator change can alter spreading and product use. Evaluate it with the intended coating and surface before adopting it across the workshop.
Set interim review and stopping rules before a coating trial so repeated checks do not turn a temporary favourable result into an overstated conclusion.

 Repeatedly Checking a Coating Trial: Set the Review Rules in Advance