

A full polishing range.
From cutting and one-step correction to final finishing.
Specialist chemistry. Expert application.
 QUARTZ99 / CERAMIC BASE COAT
The foundation of your coating system.
A layerable quartz base coat designed for mechanical protection. Pair it with a suitable top coat to create the final finish.
For application by NANOLAB certified installers only.
Four formulas. Extended working time. Find the coating for your finish.
Explore the BEAST family of ceramic coatings.
Find the coating for each exterior surface.
 PPF & VINYLGLOSSProtection for glossy films and wraps.Discover
 MATTE & SATINMATTEProtection that respects the finish.Discover
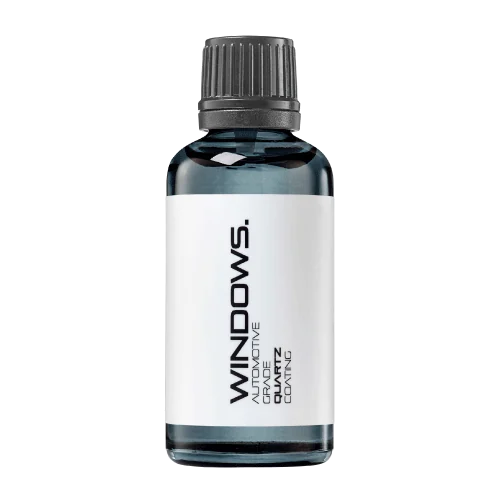 GLASSWINDOWSExplore dedicated glass protection.Discover
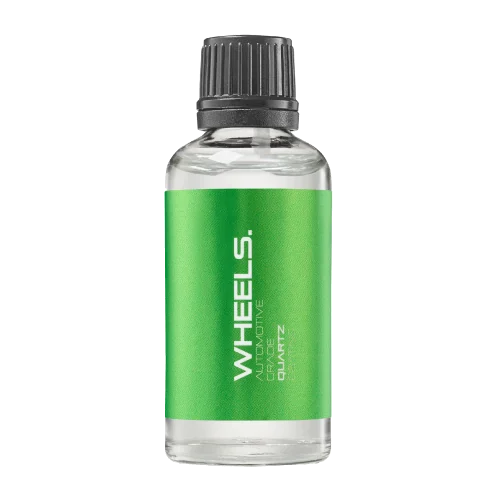 WHEEL PROTECTIONWHEELSA dedicated coating for your wheels.Discover
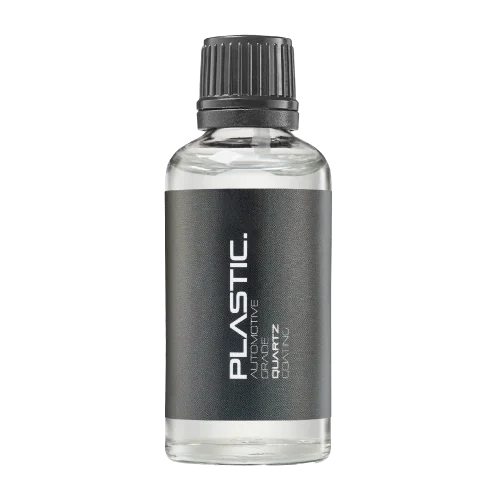 TRIM PROTECTIONPLASTICProtection for plastic surfaces.Discover
Dedicated care for the surfaces inside.
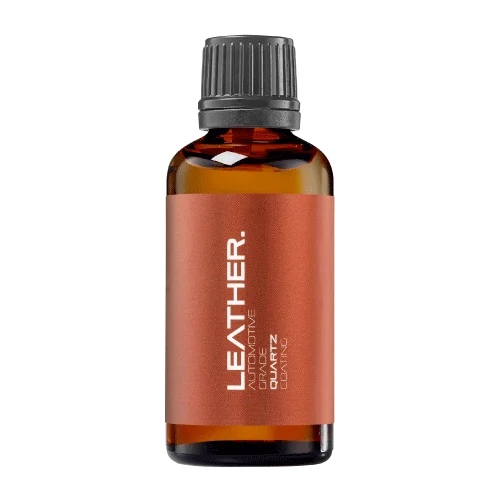 LEATHER SURFACESLEATHERDiscover NANOLAB leather protection.Discover PLASTIC SURFACESPLASTICProtection for interior plastic surfaces.Discover TEXTILE SURFACESFABRICExplore the latest fabric formulation.Discover
Spray protection, maintenance and upcoming wash products.
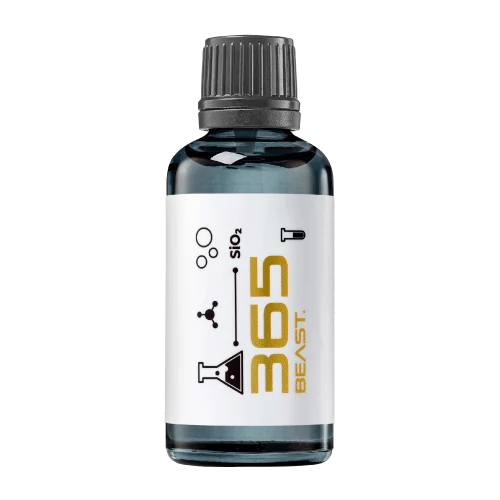 MAINTENANCEBEAST 365Explore the BEAST maintenance range.Discover
Next in washing, cleaning & care.
Ceramic protection for boats and yachts.
An easy-to-apply ceramic coating with an established track record on boats and yachts around the world.
Results vary with surface preparation, exposure and maintenance.
Read 50 MARINE guides →Explore MARINEProtection for the surfaces you live with.
A look at what we’re developing.
From cutting and one-step correction to final finishing.
A wider range for professional vehicle care.
Taking shape alongside BEAST & MATRIX.
Practical guidance for your next coating project.
Explore all guides →
The first heavy-cut cycle may produce a large improvement while the next produces very little.
Updated · NANOLAB Knowledge
The first heavy-cut cycle may produce a large improvement while the next produces very little. Plotting that change can prevent a detailer from treating every remaining mark as a reason for another identical cycle. The purpose is to recognise a slowing response, not to calculate a universal number of safe passes.
Select one practical response measure: visible reference defects, a defined haze rating or time required to reach an agreed finish. Keep the surface, lighting and inspection cleaning consistent. Record pad cleaning and changes because the pad is part of the process and its condition can alter the response.
An illustrative defect count could move from 30 before correction to 12 after one cycle and 10 after a second. The first cycle reduced the visible count by 18; the second by two. Those numbers describe that inspection area only. They say nothing directly about the depth of the remaining marks or the material removed.
A smaller improvement can have several explanations. The remaining defects may be deeper, the pad may be loaded, the machine may have lost effective contact, or inspection residue may be confusing the comparison. The curve identifies the need to investigate; it does not identify the cause by itself.
If a cleaned, correctly functioning system gives little additional benefit and the remaining defects are isolated, document them and reconsider the scope. Do not extrapolate the early improvement into a promise that several more cycles will remove everything.
Keep paint history and condition outside the performance graph as independent constraints. Even a system that still removes defects can be inappropriate for a compromised panel. The best removal curve is useful because it exposes diminishing returns early enough to change the plan.
For current NANOLAB product instructions and compatibility, visit product documentation or contact the technical team.