
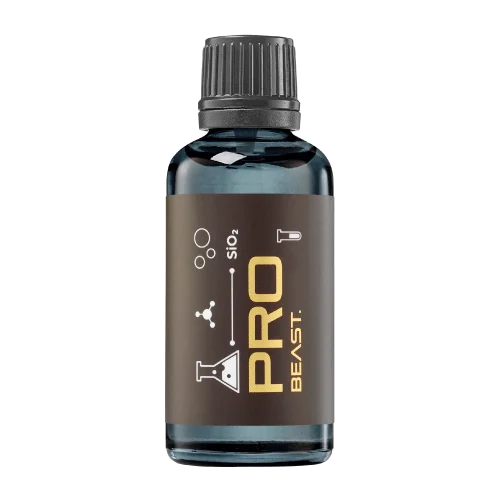

A full polishing range.
From cutting and one-step correction to final finishing.
Specialist chemistry. Expert application.
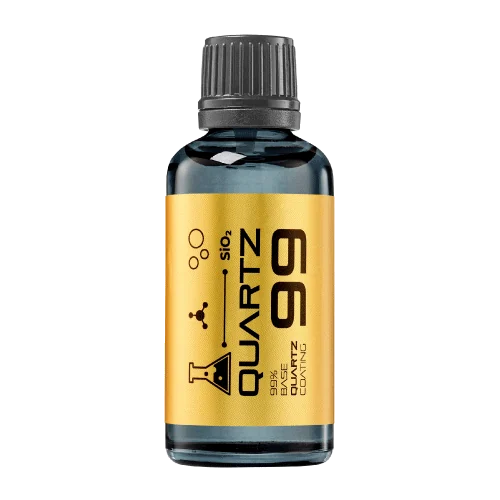 QUARTZ99 / CERAMIC BASE COAT
The foundation of your coating system.
A layerable quartz base coat designed for mechanical protection. Pair it with a suitable top coat to create the final finish.
For application by NANOLAB certified installers only.
Four formulas. Extended working time. Find the coating for your finish.
Explore the BEAST family of ceramic coatings.
Find the coating for each exterior surface.
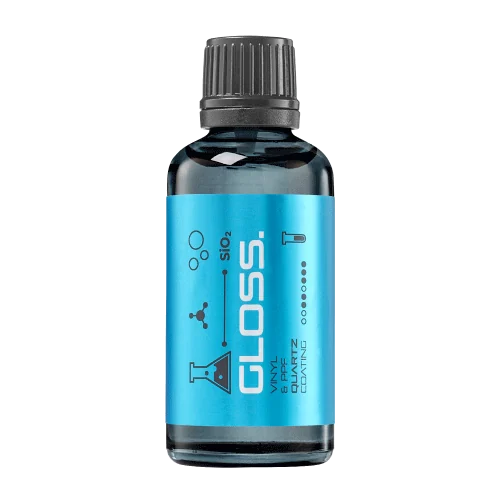 PPF & VINYLGLOSSProtection for glossy films and wraps.Discover
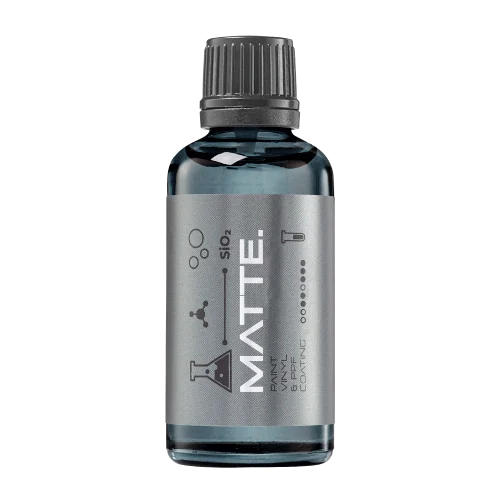 MATTE & SATINMATTEProtection that respects the finish.Discover
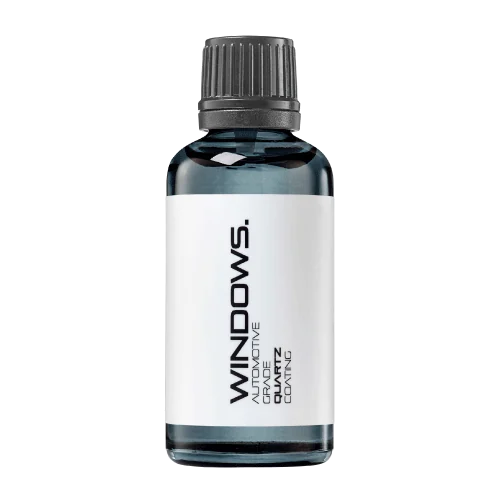 GLASSWINDOWSExplore dedicated glass protection.Discover
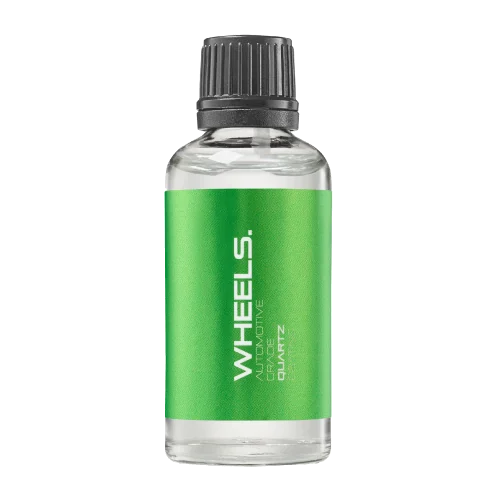 WHEEL PROTECTIONWHEELSA dedicated coating for your wheels.Discover
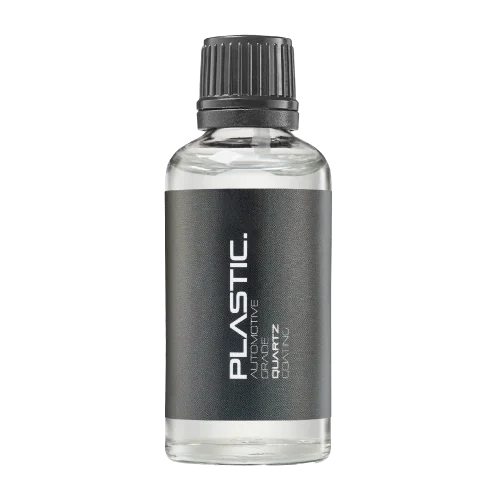 TRIM PROTECTIONPLASTICProtection for plastic surfaces.Discover
Dedicated care for the surfaces inside.
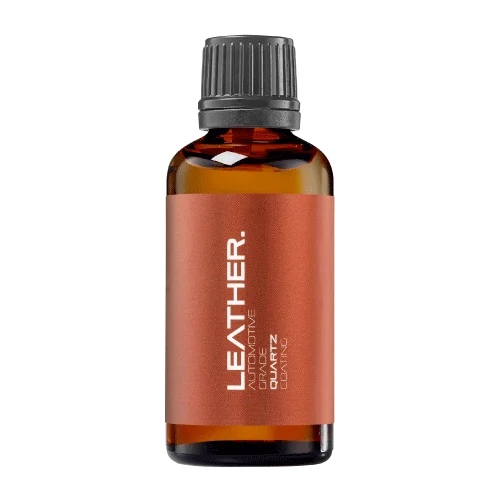 LEATHER SURFACESLEATHERDiscover NANOLAB leather protection.Discover PLASTIC SURFACESPLASTICProtection for interior plastic surfaces.Discover TEXTILE SURFACESFABRICExplore the latest fabric formulation.Discover
Spray protection, maintenance and upcoming wash products.
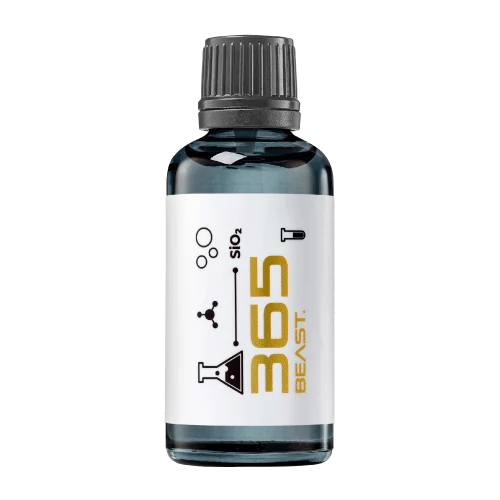 MAINTENANCEBEAST 365Explore the BEAST maintenance range.Discover
Next in washing, cleaning & care.
Ceramic protection for boats and yachts.
An easy-to-apply ceramic coating with an established track record on boats and yachts around the world.
Results vary with surface preparation, exposure and maintenance.
Read 50 MARINE guides →Explore MARINEProtection for the surfaces you live with.
A look at what we’re developing.
From cutting and one-step correction to final finishing.
A wider range for professional vehicle care.
Taking shape alongside BEAST & MATRIX.
Practical guidance for your next coating project.
Explore all guides →
A particle-size distribution must retain the basis on which it is reported. Intensity, volume and number distributions are different representations, and changing the label can change the apparent meaning of a coating ingredient's size data.
Updated · NANOLAB Knowledge
Malvern Panalytical discusses these representations and the assumptions involved in converting between them. A buyer should obtain the original report and ask which distribution supports the proposed specification. A chart dominated by one population on an intensity basis should not be relabelled as the percentage of particles without a justified analysis.
Illustrative example: a presentation describes a peak as the size of most particles, although the source chart is intensity weighted. That wording may overstate what the chart shows. A more accurate summary identifies the reported distribution and leaves population claims to an analysis that supports them.
Do not select whichever representation makes a sample look most uniform. The appropriate representation depends on the question and the measurement limitations. A tidy chart is not evidence that a finished ceramic coating will be easier to apply or more durable in customer use.
Technical references: Malvern Panalytical: Zetasizer terminology. These sources describe their stated methods or products; they do not certify NANOLAB products or establish compatibility with an unlisted surface.
Ask NANOLAB about the exact product and intended use. Use the current product documentation for formulation-specific instructions.

Early rounding can change a calculated result or obscure a borderline decision. Preserve the original measurement precision through the analysis.
Report missing coating-trial follow-ups as unknown outcomes and keep enrolled, inspected and passing sample counts visible.
A scratch-test result should identify the tool geometry as well as the applied load. Different tips can create different contact conditions, so a load-only comparison is incomplete.