
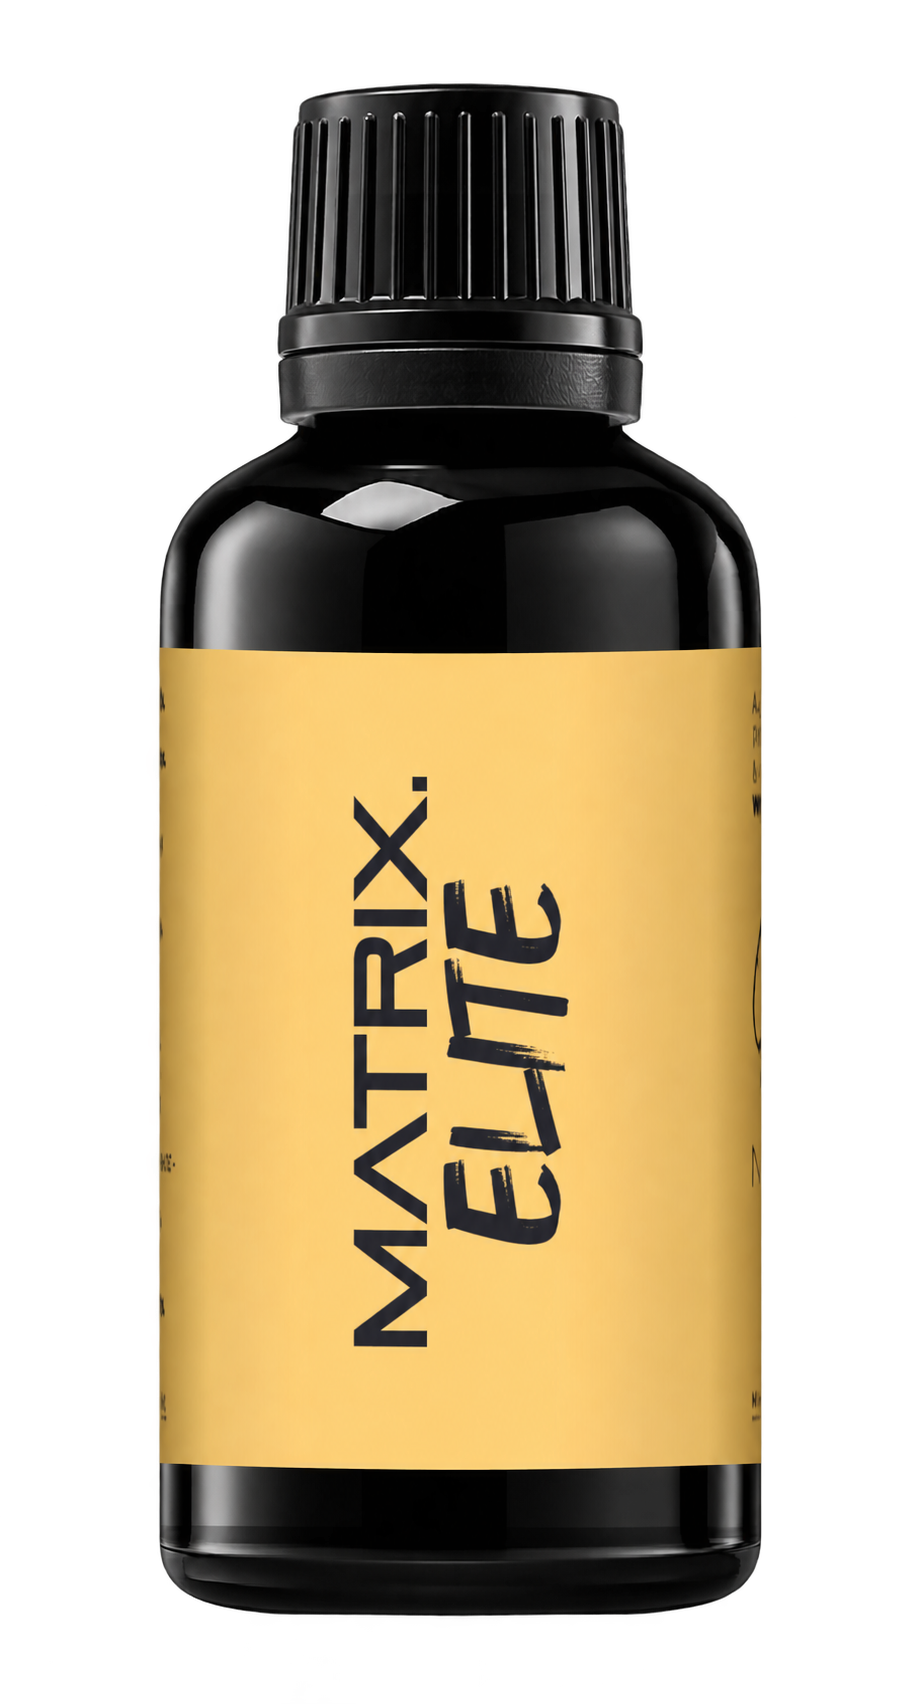
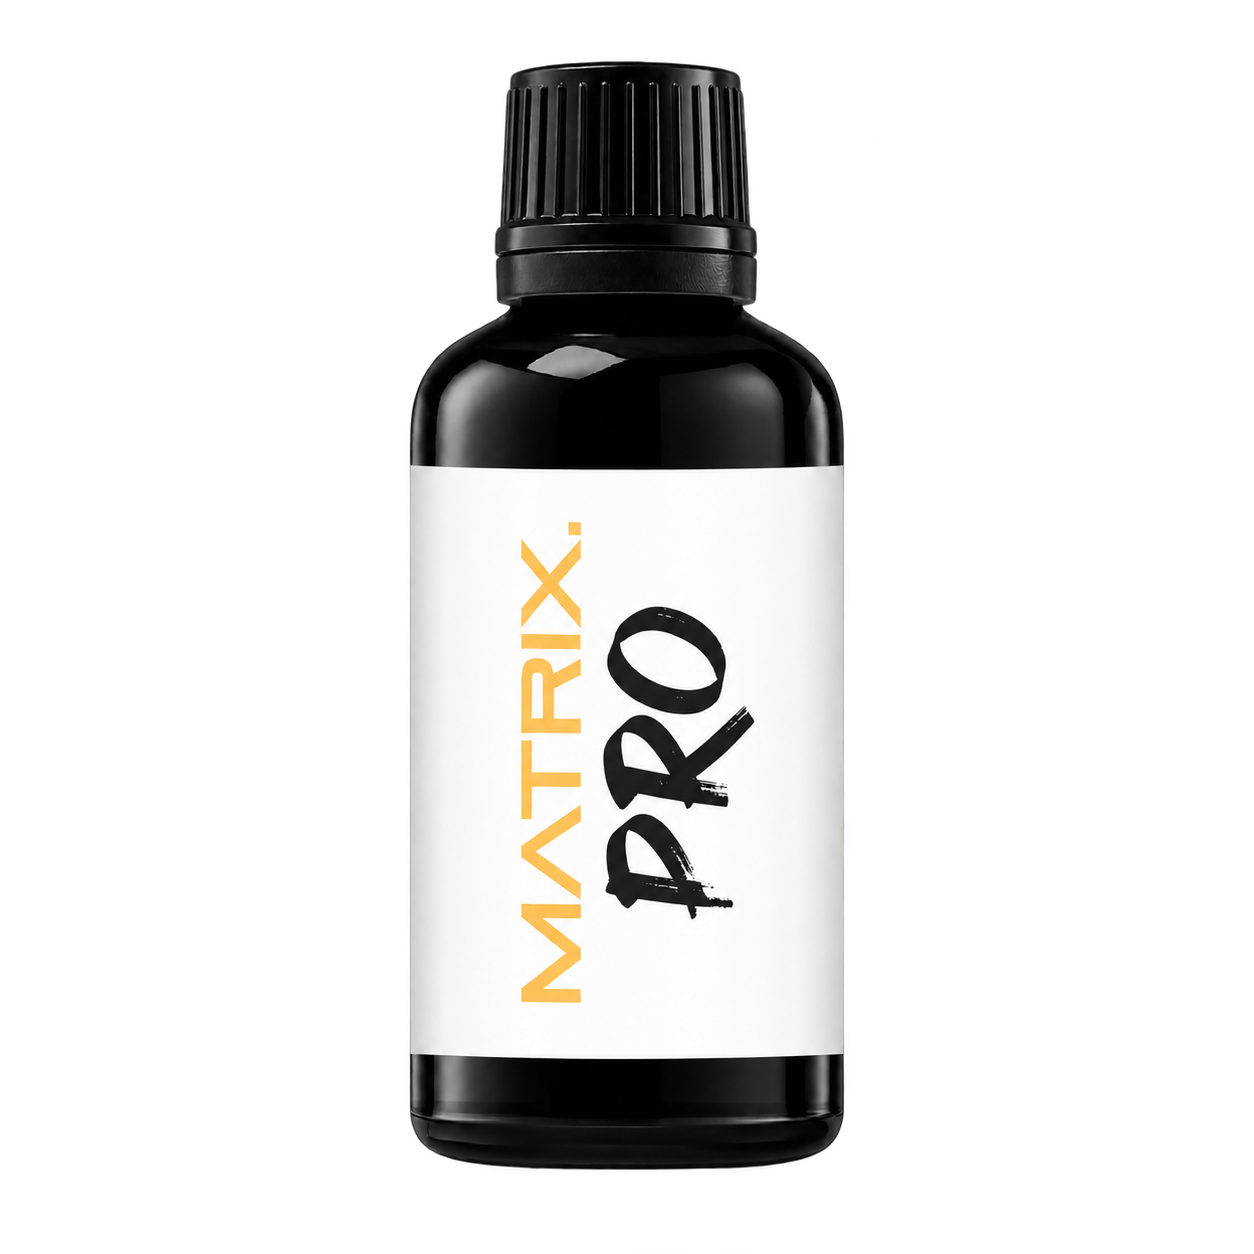
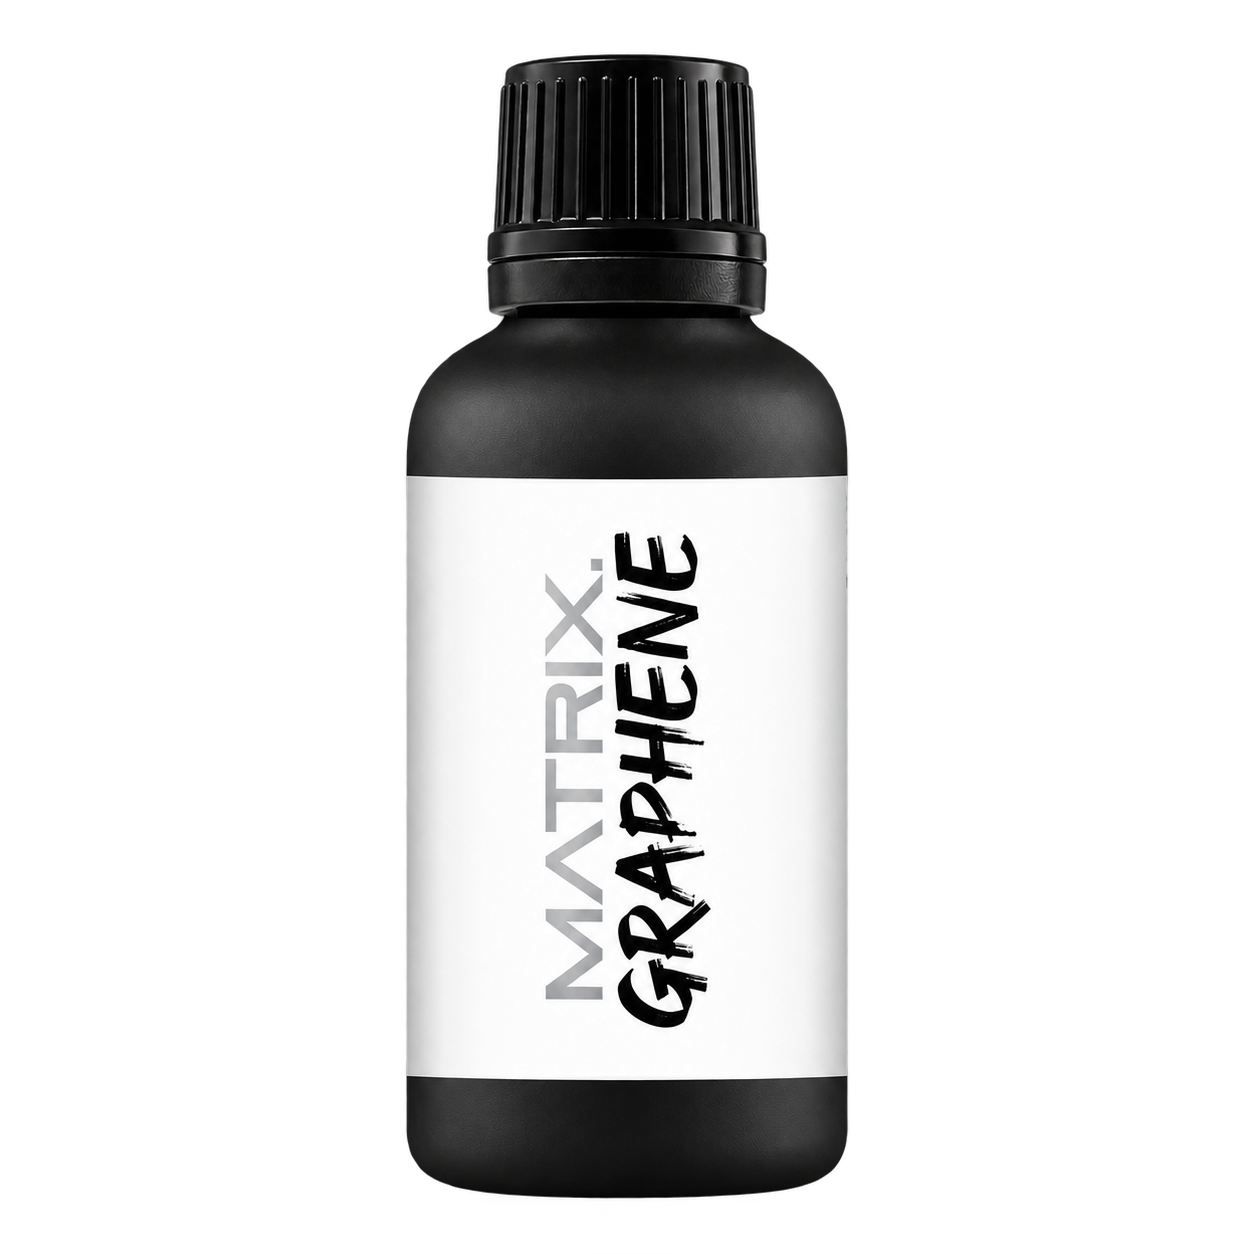
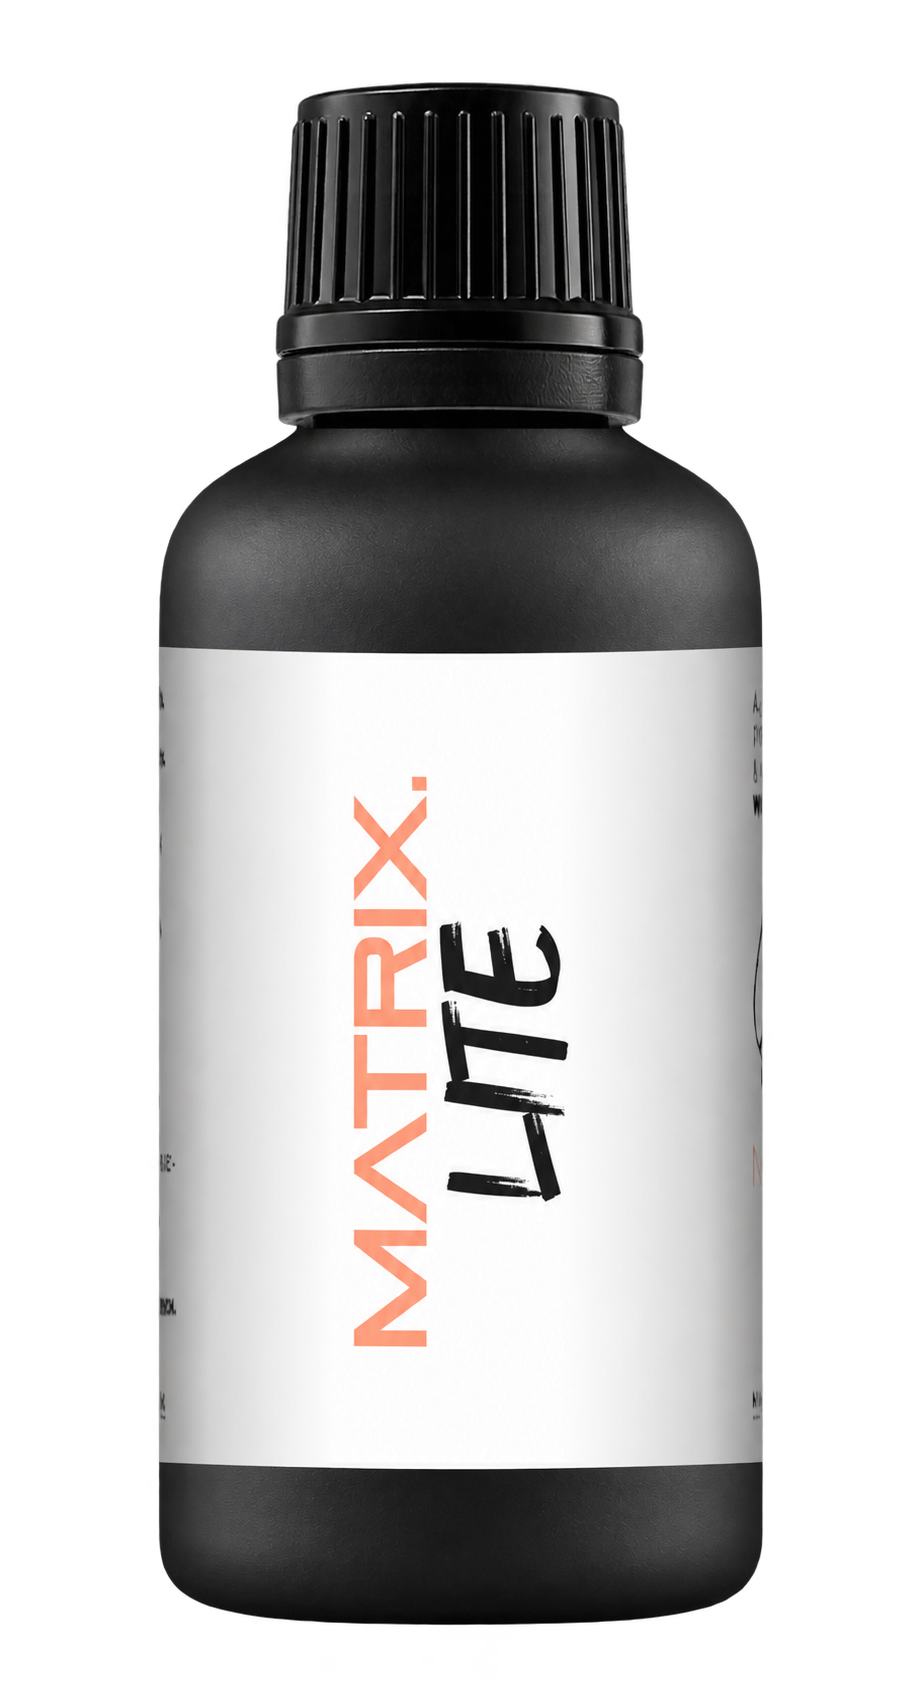


A full polishing range.
From cutting and one-step correction to final finishing.
Specialist chemistry. Expert application.
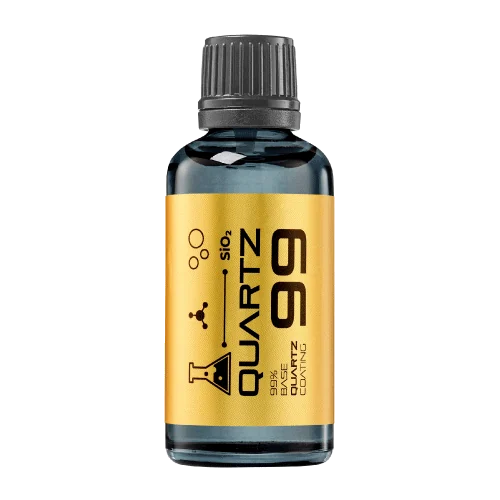 QUARTZ99 / CERAMIC BASE COAT
The foundation of your coating system.
A layerable quartz base coat designed for mechanical protection. Pair it with a suitable top coat to create the final finish.
For application by NANOLAB certified installers only.
Four formulas. Extended working time. Find the coating for your finish.
Explore the BEAST family of ceramic coatings.
Find the coating for each exterior surface.
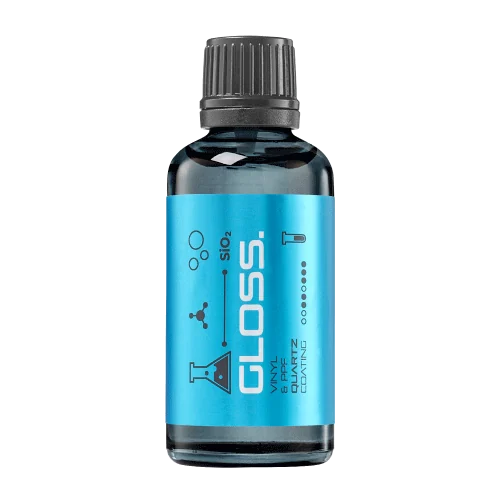 PPF & VINYLGLOSSProtection for glossy films and wraps.Discover
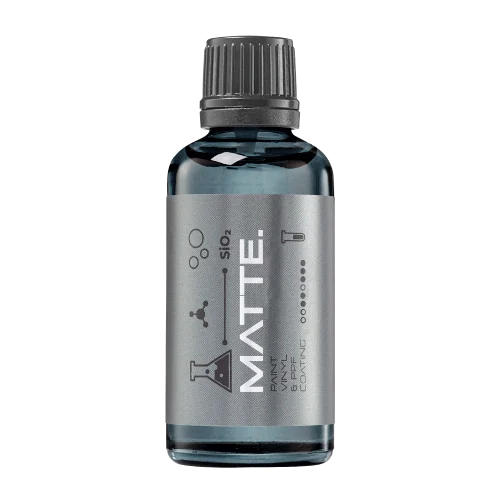 MATTE & SATINMATTEProtection that respects the finish.Discover
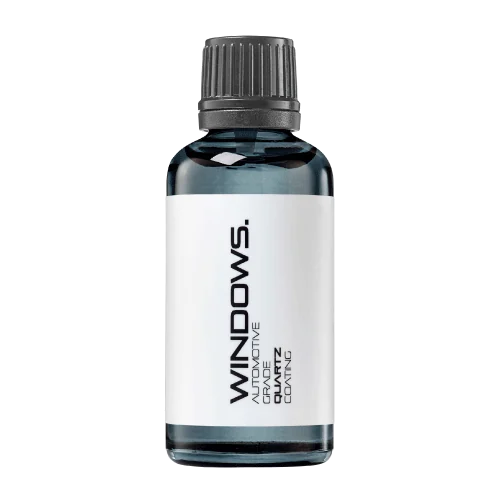 GLASSWINDOWSExplore dedicated glass protection.Discover
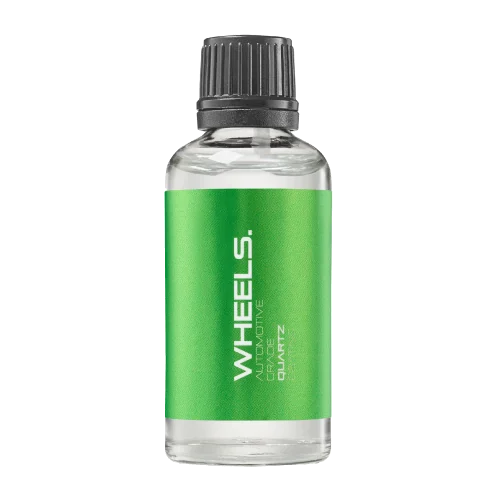 WHEEL PROTECTIONWHEELSA dedicated coating for your wheels.Discover
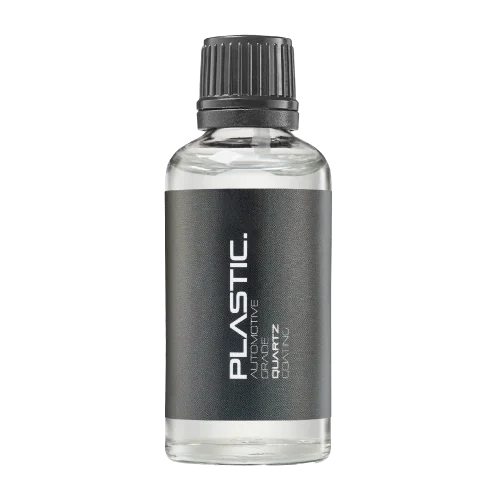 TRIM PROTECTIONPLASTICProtection for plastic surfaces.Discover
Dedicated care for the surfaces inside.
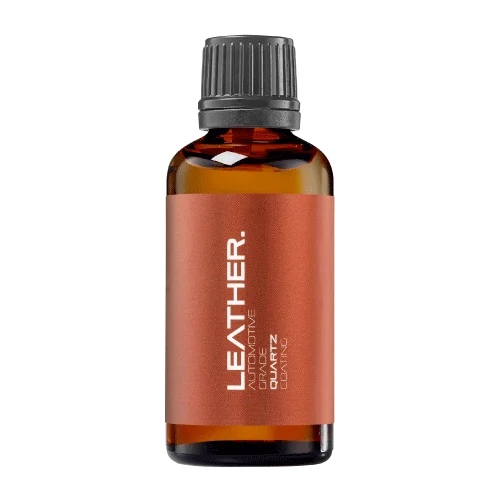 LEATHER SURFACESLEATHERDiscover NANOLAB leather protection.Discover PLASTIC SURFACESPLASTICProtection for interior plastic surfaces.Discover TEXTILE SURFACESFABRICExplore the latest fabric formulation.Discover
Spray protection, maintenance and upcoming wash products.
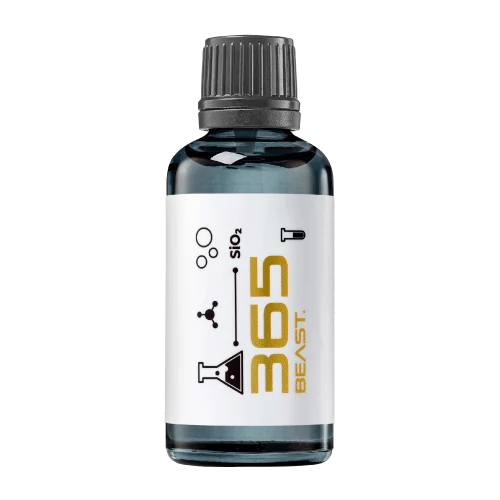 MAINTENANCEBEAST 365Explore the BEAST maintenance range.Discover
Next in washing, cleaning & care.
Ceramic protection for boats and yachts.
An easy-to-apply ceramic coating with an established track record on boats and yachts around the world.
Results vary with surface preparation, exposure and maintenance.
Read 50 MARINE guides →Explore MARINEProtection for the surfaces you live with.
A look at what we’re developing.
From cutting and one-step correction to final finishing.
A wider range for professional vehicle care.
Taking shape alongside BEAST & MATRIX.
Practical guidance for your next coating project.
Explore all guides →
Inventory turnover should compare a defined cost flow with inventory measured on a compatible basis. Dividing sales revenue by stock cost mixes different quantities and can make the resulting ratio difficult to interpret.
Updated · NANOLAB Knowledge
For an operational cost-based view, define the relevant cost of goods sold and the average inventory value over the same period. The averaging method should represent the business's stock pattern reasonably. A year-end snapshot may be unrepresentative for a seasonal coating range or a large launch purchase.
Arithmetic example: a hypothetical range has 24,000 in cost of goods sold and average inventory of 6,000 on the same cost basis. The turnover ratio is four for that period. Using revenue of 48,000 instead would create a different ratio and should not be labelled as the same calculation.
This example is not a target for coating distributors. A higher ratio can coexist with stockouts, and a lower ratio can reflect a planned supply decision. Use the metric with availability and stock-condition information rather than as a standalone instruction to reduce inventory.
Discuss bulk supply and private-label requirements with NANOLAB. Use the current product documentation for formulation-specific instructions.

Compare coating feedback with units, installations and exposure in view instead of judging quality from complaint counts alone.

Compare private label ceramic coatings by measured usable yield per vehicle, including application waste, accessories and the service scope.

A low-cost product line can still create expensive support work if customers choose the wrong variant or misunderstand the sequence. Track confusion as a specific operational issue instead of treating every enquiry as an unavoidable part of selling coatings.