
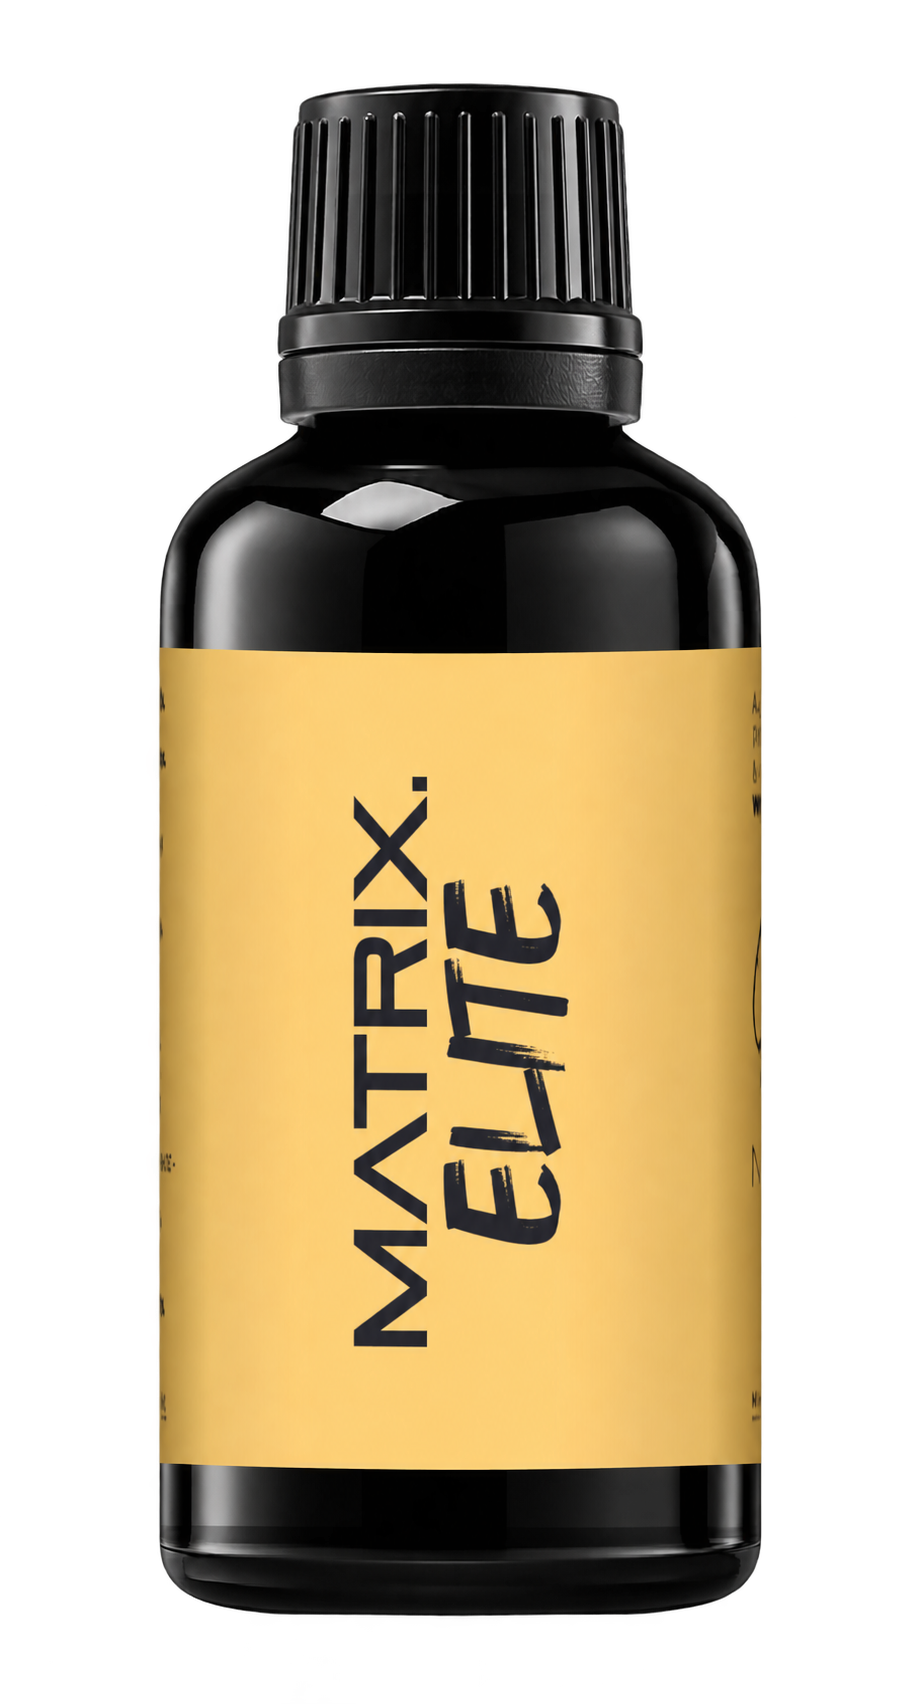
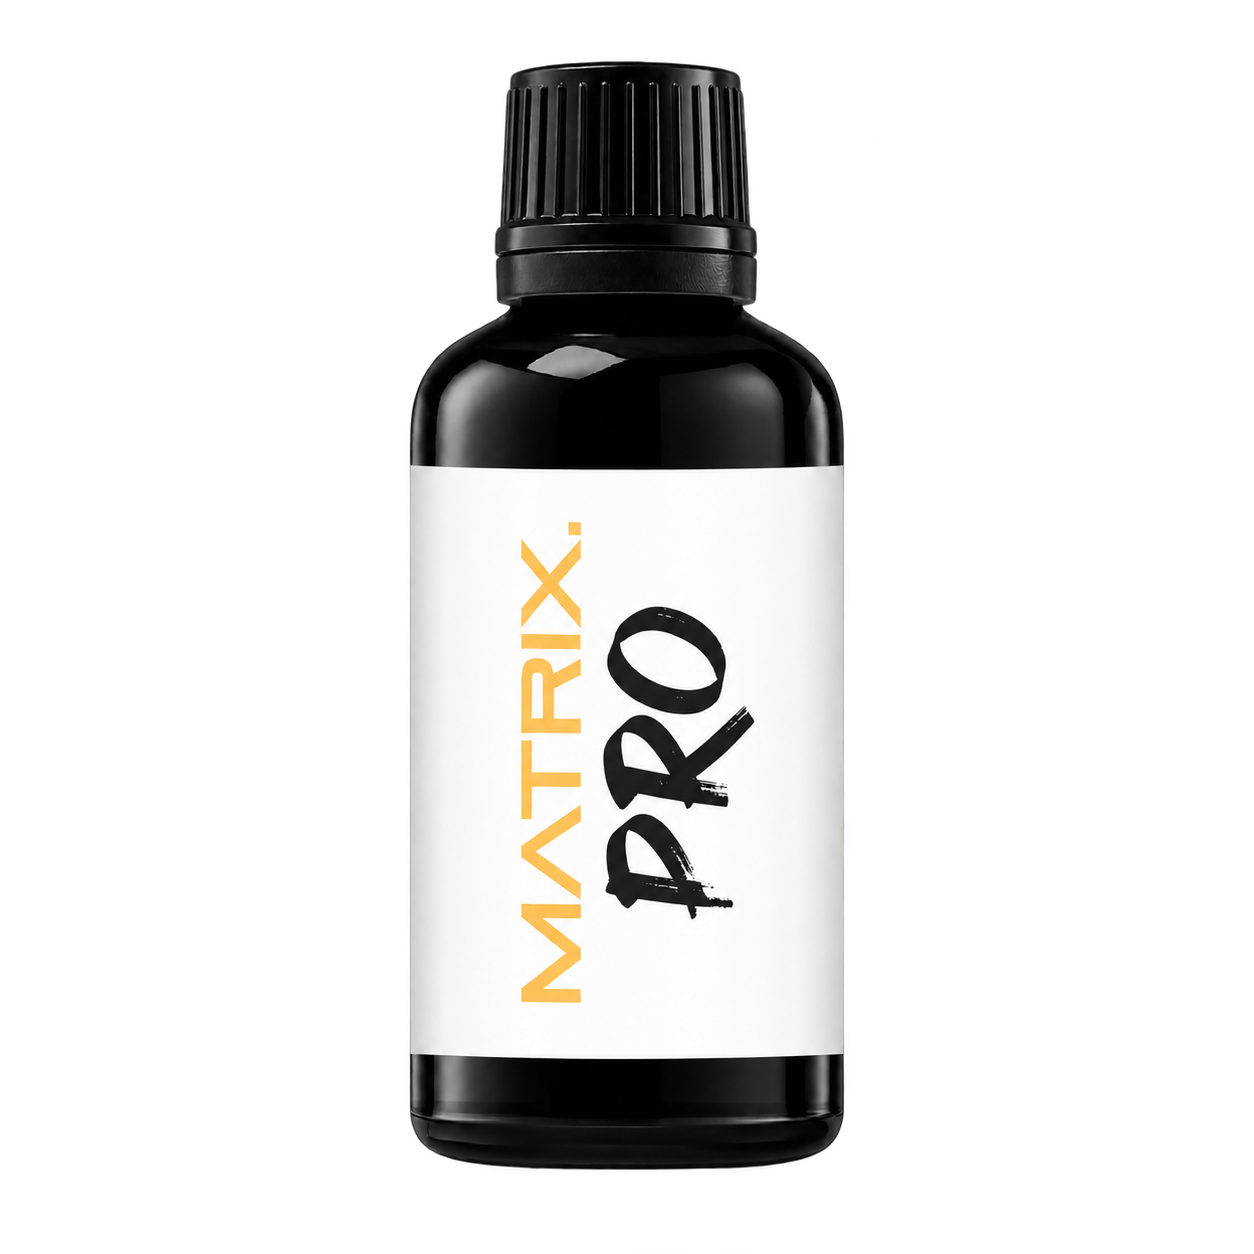
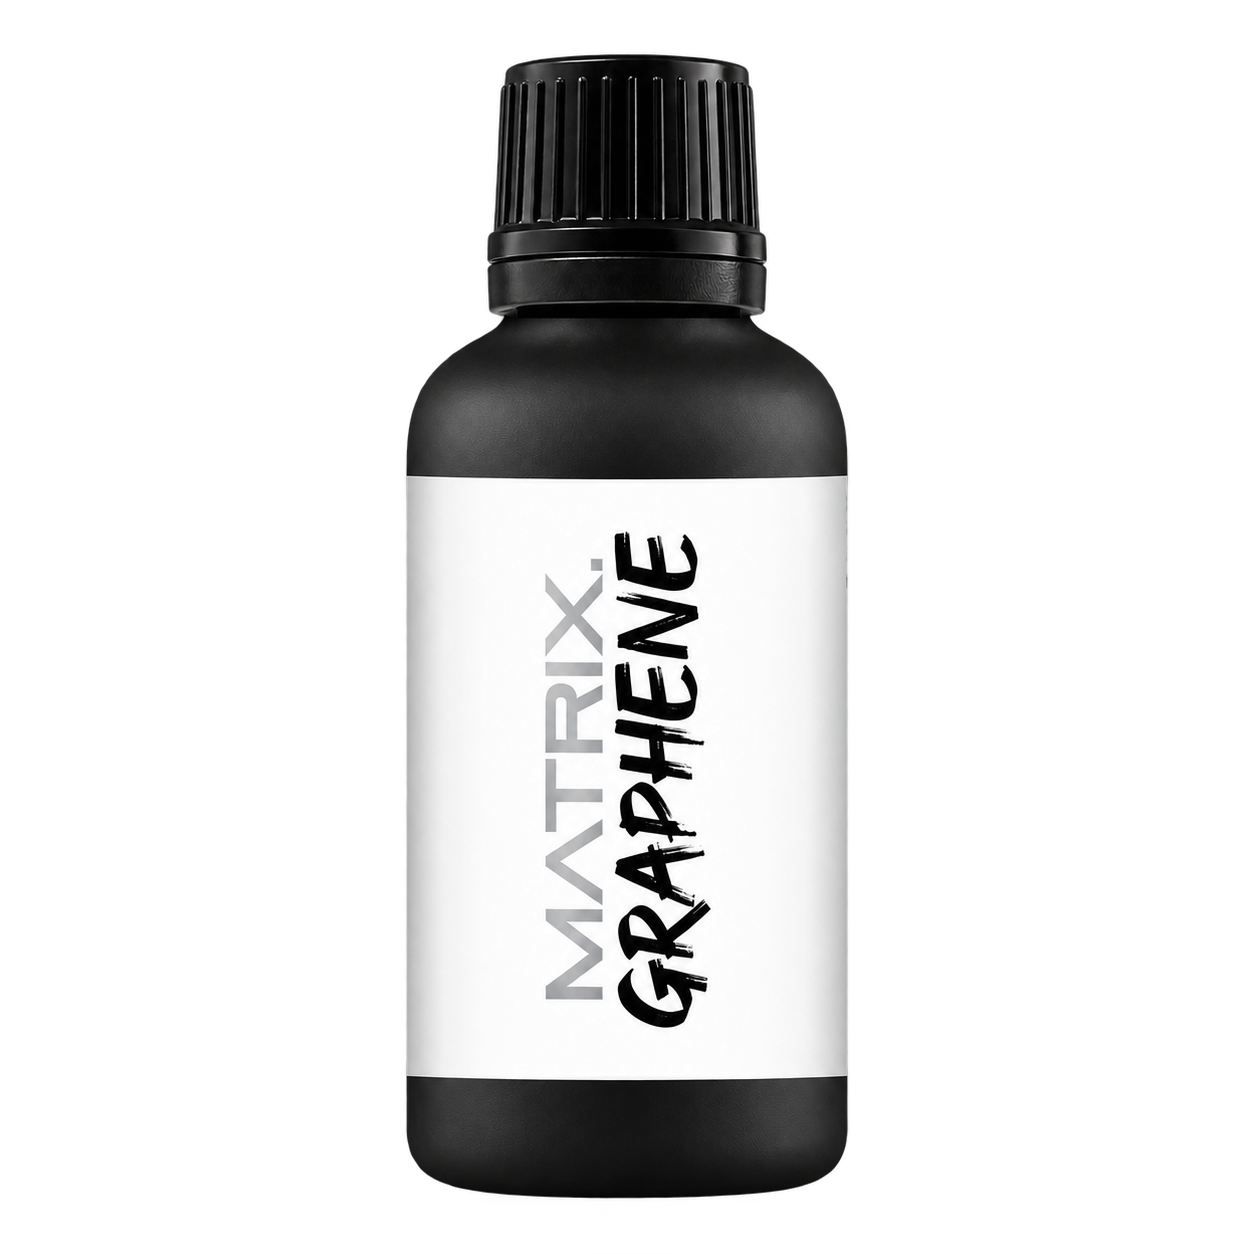
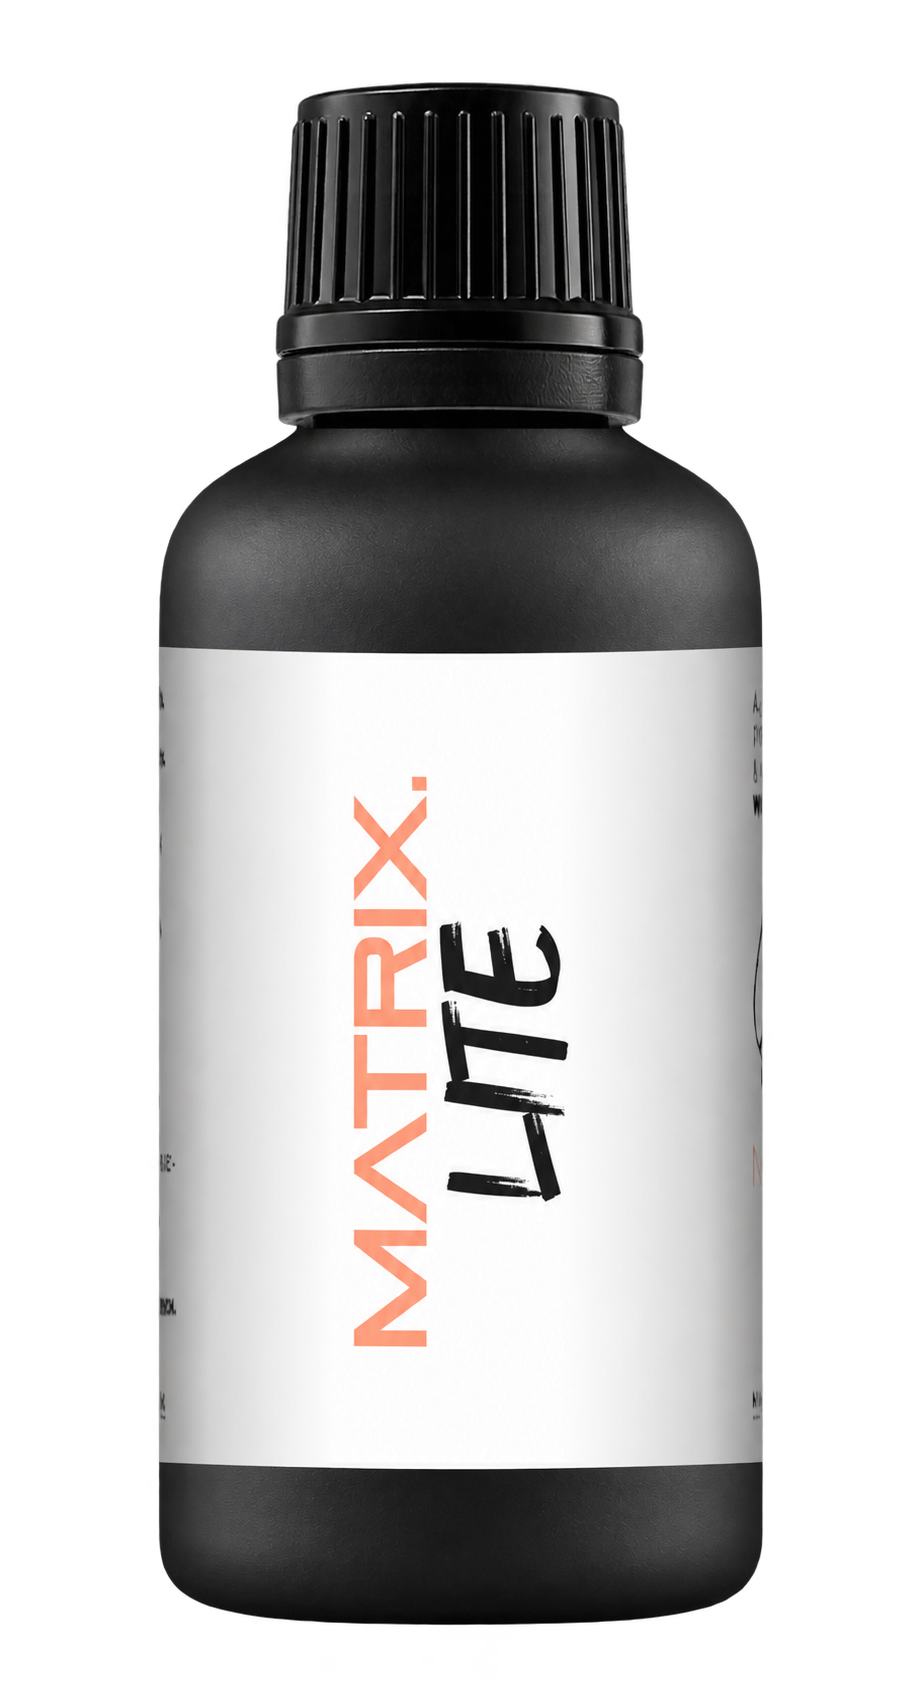


A full polishing range.
From cutting and one-step correction to final finishing.
Specialist chemistry. Expert application.
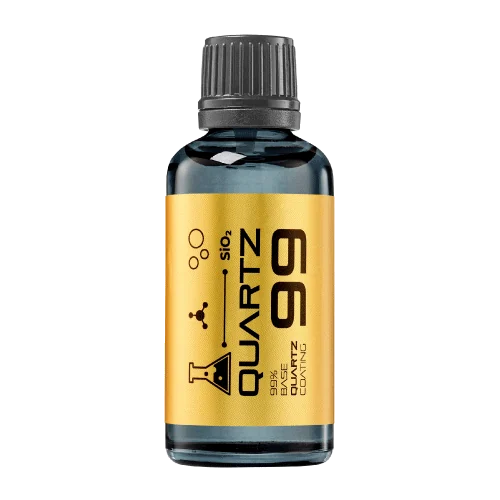 QUARTZ99 / CERAMIC BASE COAT
The foundation of your coating system.
A layerable quartz base coat designed for mechanical protection. Pair it with a suitable top coat to create the final finish.
For application by NANOLAB certified installers only.
Four formulas. Extended working time. Find the coating for your finish.
Explore the BEAST family of ceramic coatings.
Find the coating for each exterior surface.
 PPF & VINYLGLOSSProtection for glossy films and wraps.Discover
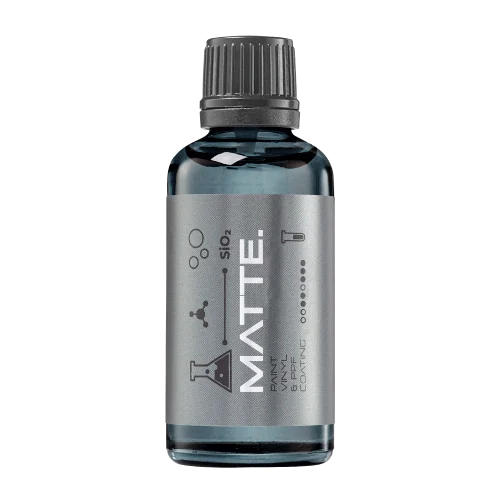 MATTE & SATINMATTEProtection that respects the finish.Discover
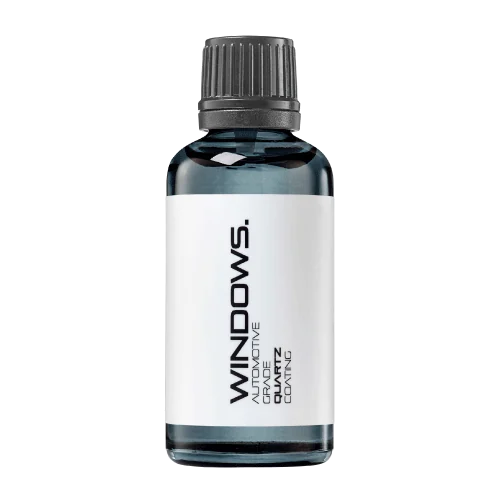 GLASSWINDOWSExplore dedicated glass protection.Discover
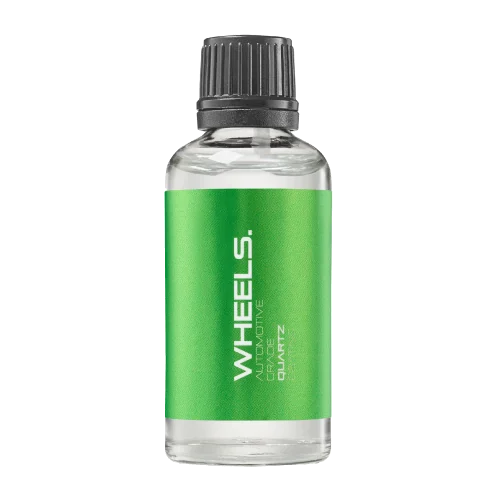 WHEEL PROTECTIONWHEELSA dedicated coating for your wheels.Discover
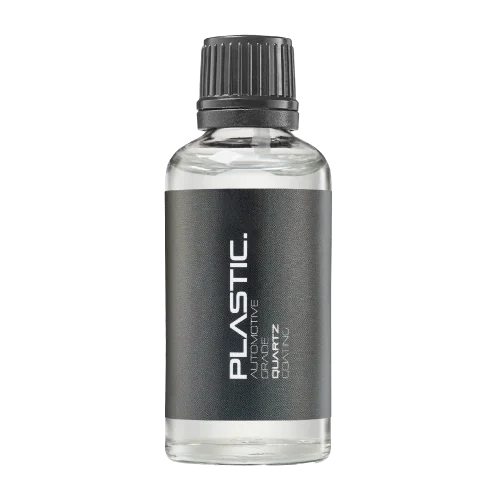 TRIM PROTECTIONPLASTICProtection for plastic surfaces.Discover
Dedicated care for the surfaces inside.
 LEATHER SURFACESLEATHERDiscover NANOLAB leather protection.Discover PLASTIC SURFACESPLASTICProtection for interior plastic surfaces.Discover TEXTILE SURFACESFABRICExplore the latest fabric formulation.Discover
Spray protection, maintenance and upcoming wash products.
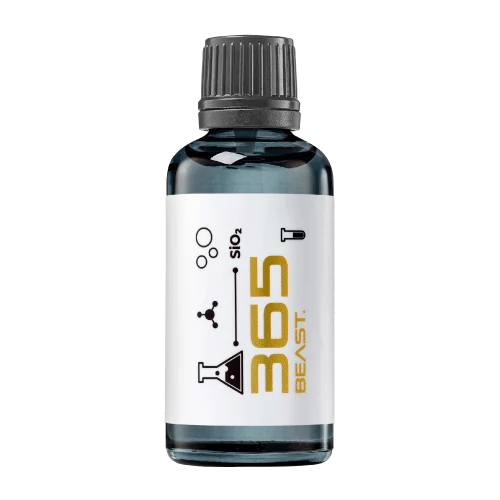 MAINTENANCEBEAST 365Explore the BEAST maintenance range.Discover
Next in washing, cleaning & care.
Ceramic protection for boats and yachts.
An easy-to-apply ceramic coating with an established track record on boats and yachts around the world.
Results vary with surface preparation, exposure and maintenance.
Read 50 MARINE guides →Explore MARINEProtection for the surfaces you live with.
A look at what we’re developing.
From cutting and one-step correction to final finishing.
A wider range for professional vehicle care.
Taking shape alongside BEAST & MATRIX.
Practical guidance for your next coating project.
Explore all guides →
A logarithmic axis represents proportional changes differently from a linear axis. Label it clearly so readers do not interpret equal visual distances as equal absolute differences in a coating comparison.
Updated · NANOLAB Knowledge
A log scale can be useful when values span a broad range, but the reason for using it should be apparent. Keep units and tick labels visible. Values that cannot be represented on the chosen scale require an explicit treatment rather than silent removal from the chart.
Arithmetic example: on a base-ten logarithmic axis, the distance from 1 to 10 equals the distance from 10 to 100. Both represent a tenfold increase, although the absolute changes differ. A reader needs that context before judging the visual size of a coating result's change.
Do not select a scale to exaggerate or conceal a preferred result. This guide does not recommend a transformation for every dataset. The analyst should choose a display suited to the question and make the representation clear enough for a non-specialist buyer to interpret accurately.
Ask NANOLAB about the exact product and intended use. Use the current product documentation for formulation-specific instructions.

A truncated or hidden scale can exaggerate a small difference. Readers need enough context to understand the magnitude.

Investigate an unusual coating test result with a documented process instead of automatically deleting it or treating it as definitive.
A coating rheology comparison should identify the measurement geometry and gap, alongside the result. Missing setup details can make an apparently precise comparison difficult to reproduce or assess.