


A full polishing range.
From cutting and one-step correction to final finishing.
Specialist chemistry. Expert application.
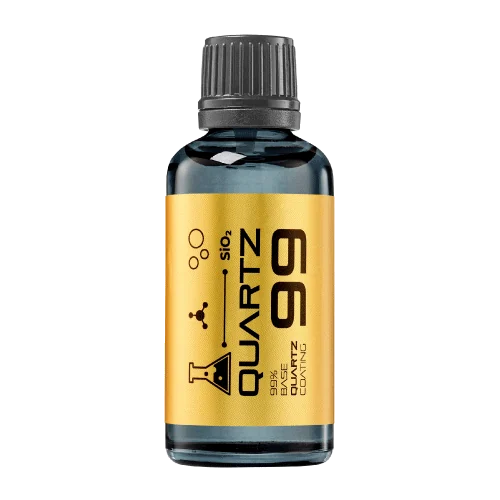 QUARTZ99 / CERAMIC BASE COAT
The foundation of your coating system.
A layerable quartz base coat designed for mechanical protection. Pair it with a suitable top coat to create the final finish.
For application by NANOLAB certified installers only.
Four formulas. Extended working time. Find the coating for your finish.
Explore the BEAST family of ceramic coatings.
Find the coating for each exterior surface.
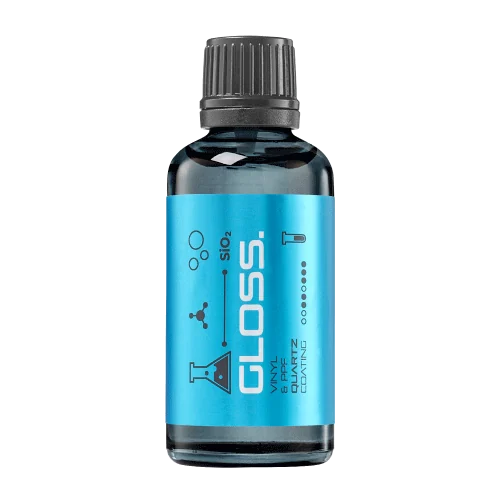 PPF & VINYLGLOSSProtection for glossy films and wraps.Discover
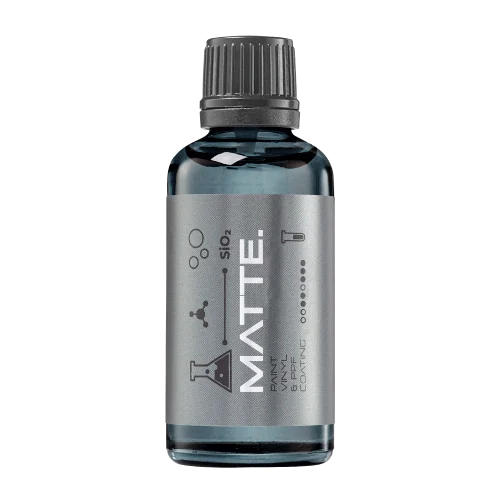 MATTE & SATINMATTEProtection that respects the finish.Discover
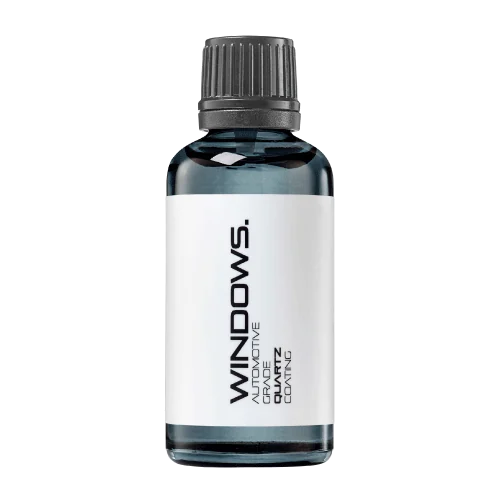 GLASSWINDOWSExplore dedicated glass protection.Discover
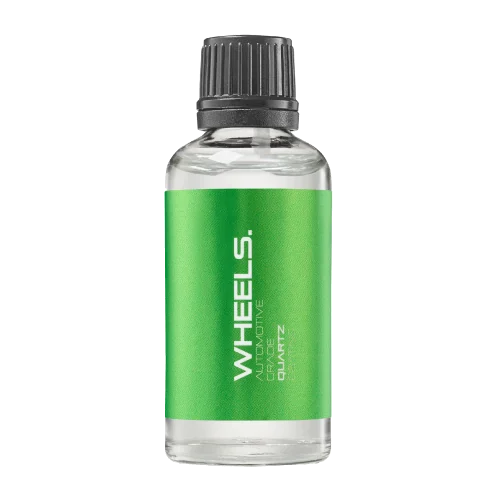 WHEEL PROTECTIONWHEELSA dedicated coating for your wheels.Discover
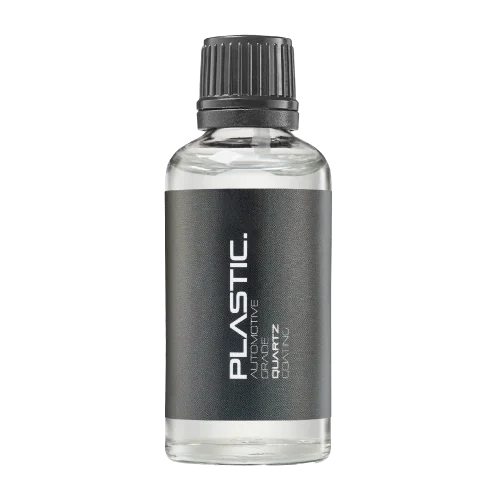 TRIM PROTECTIONPLASTICProtection for plastic surfaces.Discover
Dedicated care for the surfaces inside.
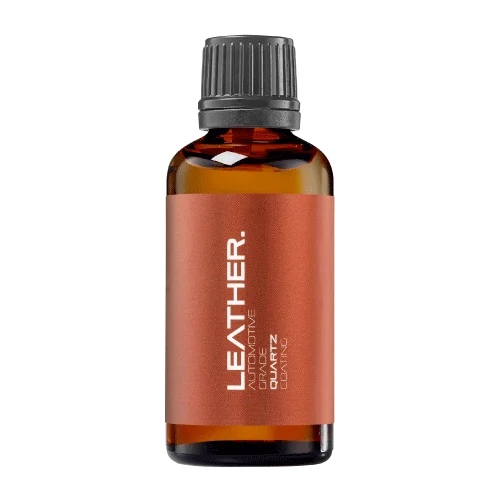 LEATHER SURFACESLEATHERDiscover NANOLAB leather protection.Discover PLASTIC SURFACESPLASTICProtection for interior plastic surfaces.Discover TEXTILE SURFACESFABRICExplore the latest fabric formulation.Discover
Spray protection, maintenance and upcoming wash products.
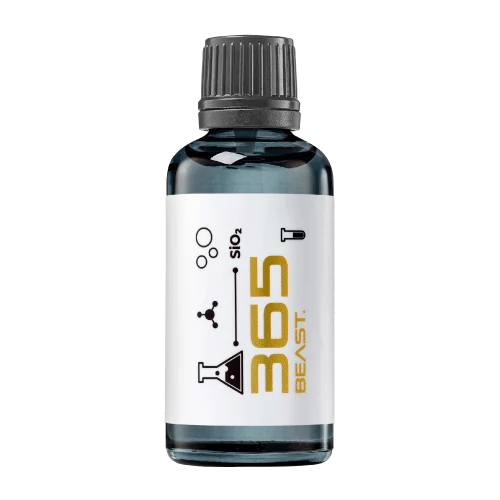 MAINTENANCEBEAST 365Explore the BEAST maintenance range.Discover
Next in washing, cleaning & care.
Ceramic protection for boats and yachts.
An easy-to-apply ceramic coating with an established track record on boats and yachts around the world.
Results vary with surface preparation, exposure and maintenance.
Read 50 MARINE guides →Explore MARINEProtection for the surfaces you live with.
A look at what we’re developing.
From cutting and one-step correction to final finishing.
A wider range for professional vehicle care.
Taking shape alongside BEAST & MATRIX.
Practical guidance for your next coating project.
Explore all guides →
A histogram can help show the distribution of coating-trial results, but its appearance depends on how values are grouped. State the bins and avoid choosing a grouping solely because it makes a product look more consistent.
Updated · NANOLAB Knowledge
Very broad bins can hide variation, while very narrow bins can make a small dataset look irregular. The useful display should support the question and remain connected to the underlying sample count. Where practical, show individual values or another complementary view so the reader can assess what the grouping conceals.
Illustrative example: two product distributions are plotted with different bin widths, making one appear smoother. The visual contrast may reflect the chart settings rather than a meaningful product difference. Replotting with a common basis allows a fairer interpretation of the actual observations.
Do not treat a histogram shape from a very small sample as proof of a population distribution. This guide does not select a statistical model. It explains a presentation choice that should remain transparent when a chart supports a coating-quality or consistency claim.
Ask NANOLAB about the exact product and intended use. Use the current product documentation for formulation-specific instructions.

A truncated or hidden scale can exaggerate a small difference. Readers need enough context to understand the magnitude.
A score compresses observations into a category. Retaining the underlying observations allows later review when the scoring rule is questioned.
Editing settings can change the apparent contrast, colour and clarity of a coating comparison. Preserve the original photographs and apply a consistent, disclosed processing approach when images are used as evidence.