
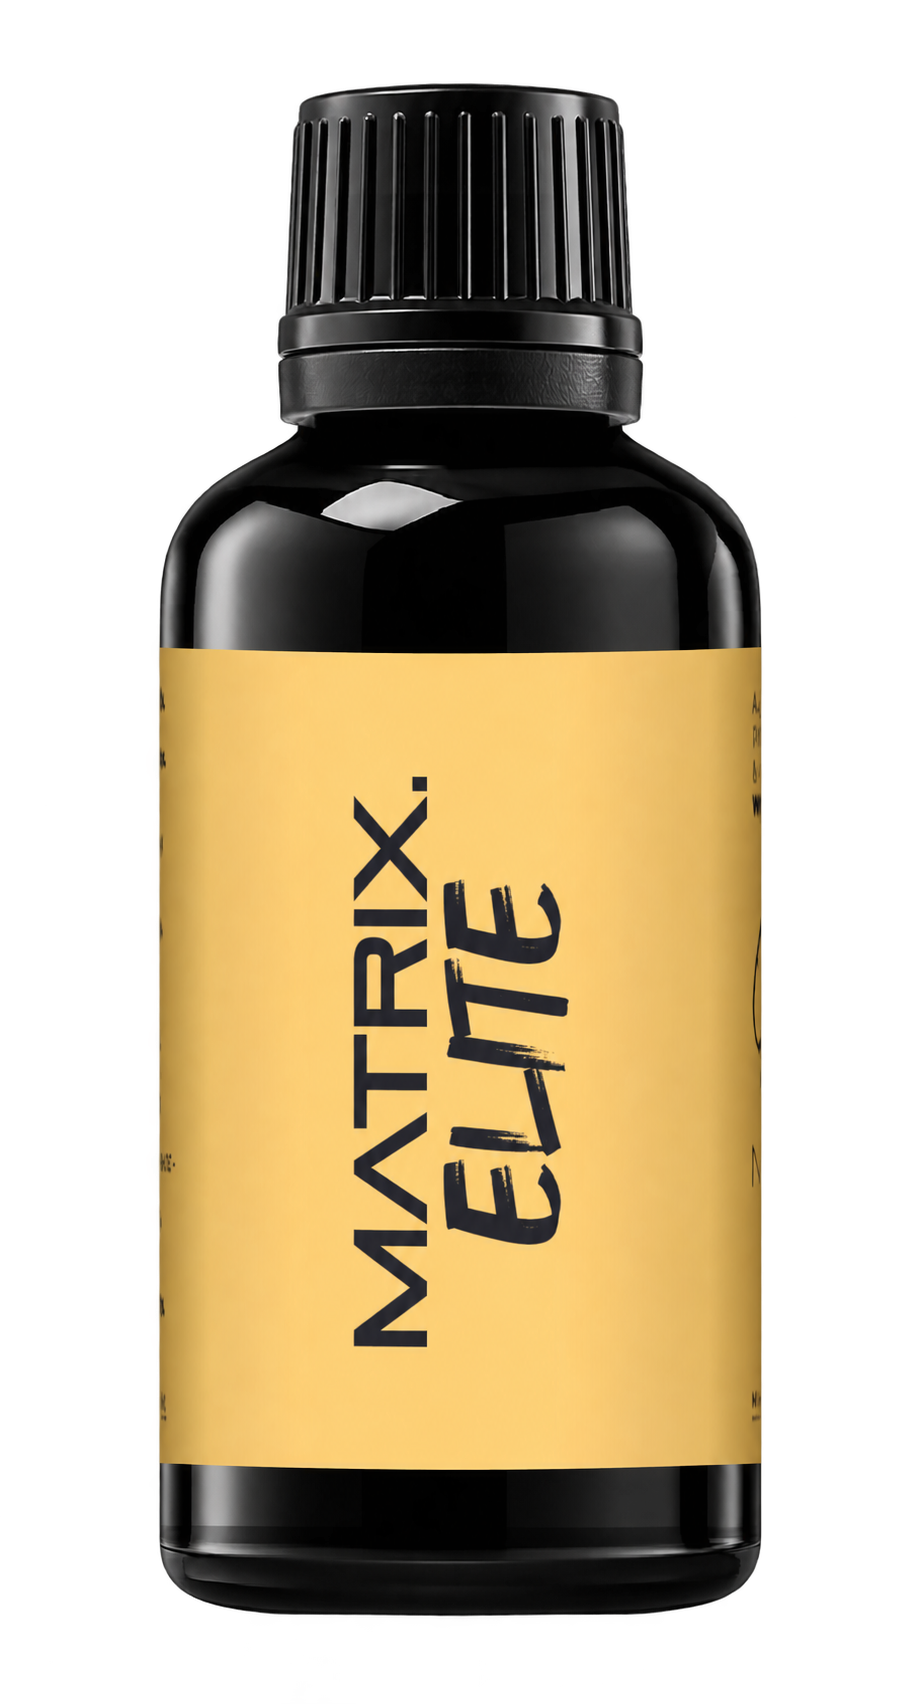
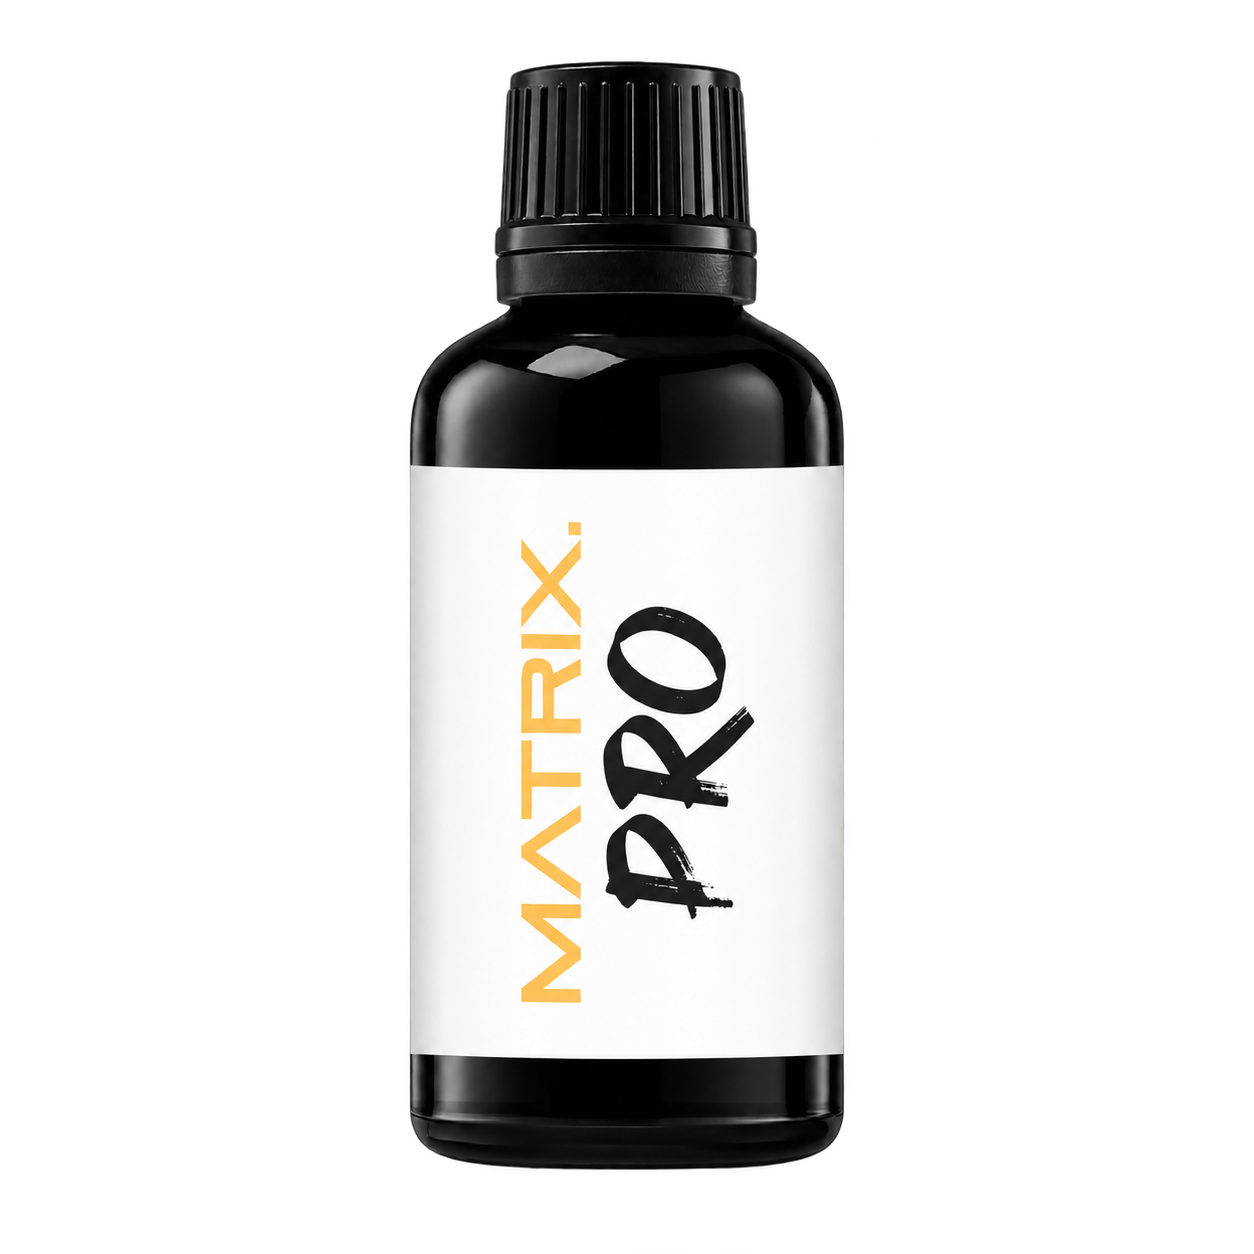
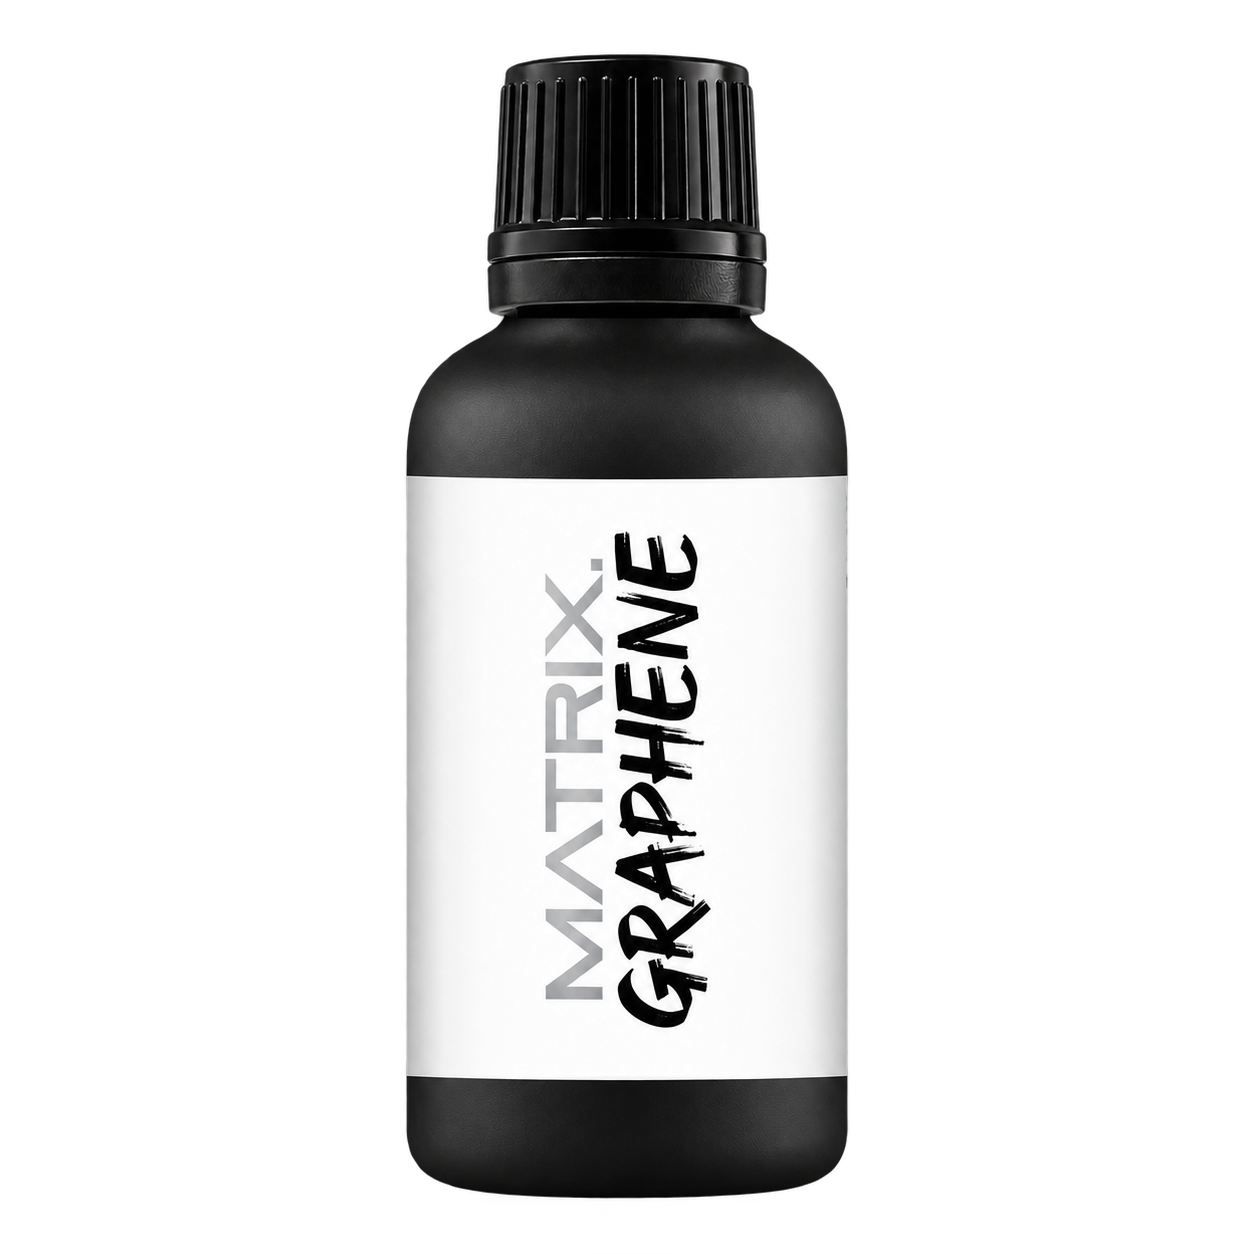
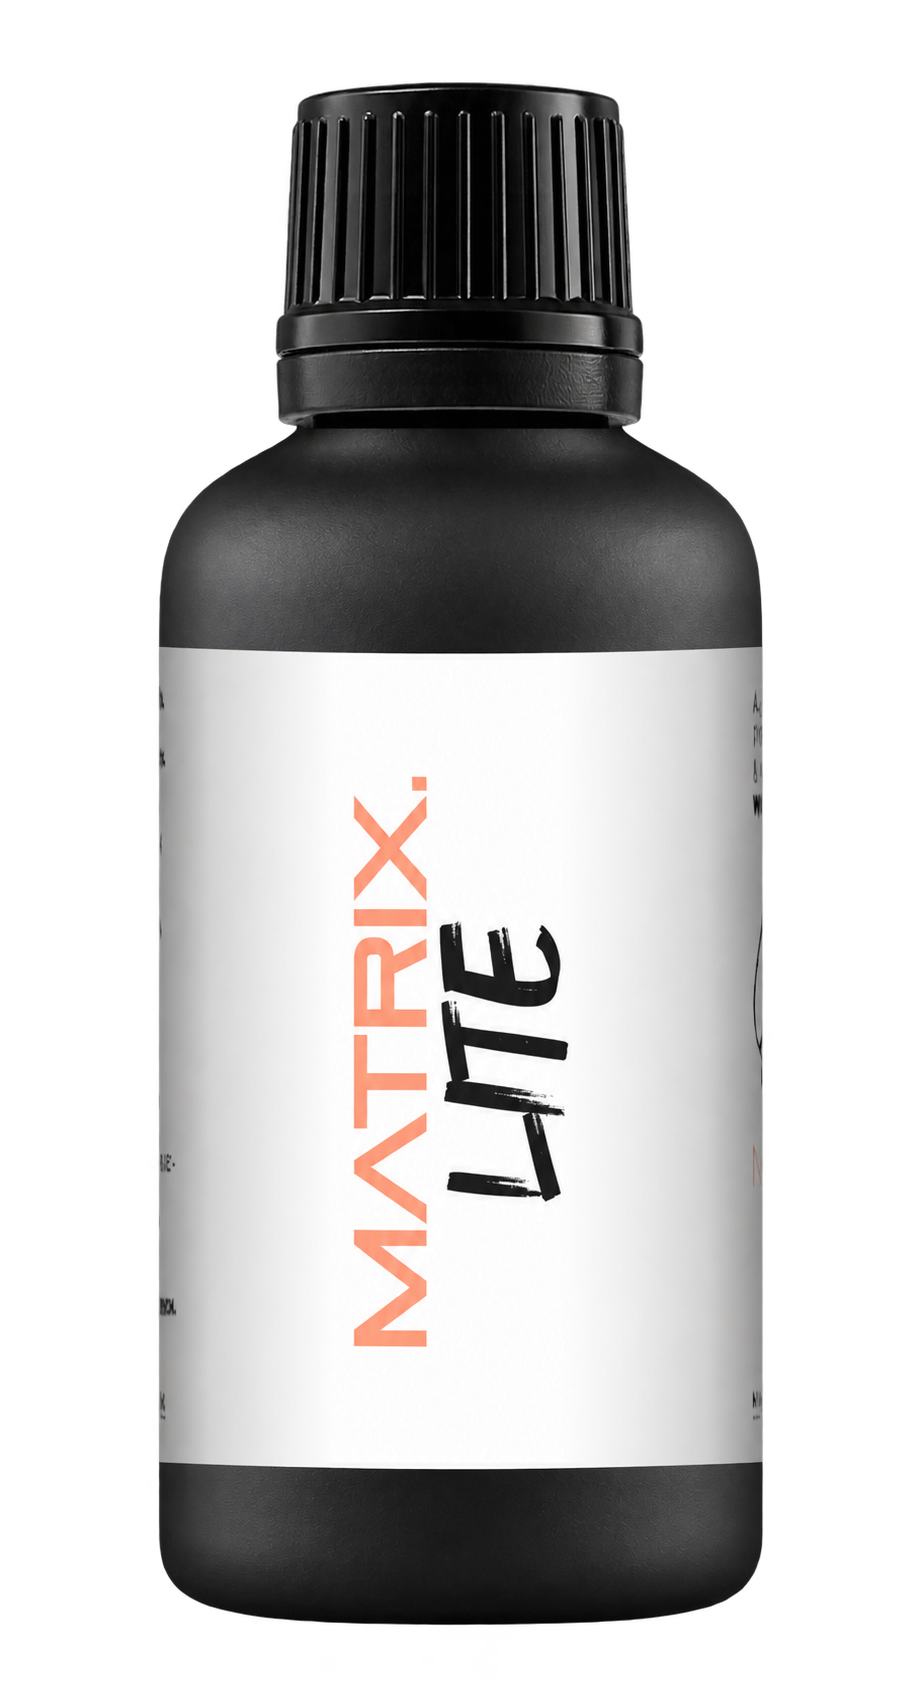

A full polishing range.
From cutting and one-step correction to final finishing.
Specialist chemistry. Expert application.
 QUARTZ99 / CERAMIC BASE COAT
The foundation of your coating system.
A layerable quartz base coat designed for mechanical protection. Pair it with a suitable top coat to create the final finish.
For application by NANOLAB certified installers only.
Four formulas. Extended working time. Find the coating for your finish.
Explore the BEAST family of ceramic coatings.
Find the coating for each exterior surface.
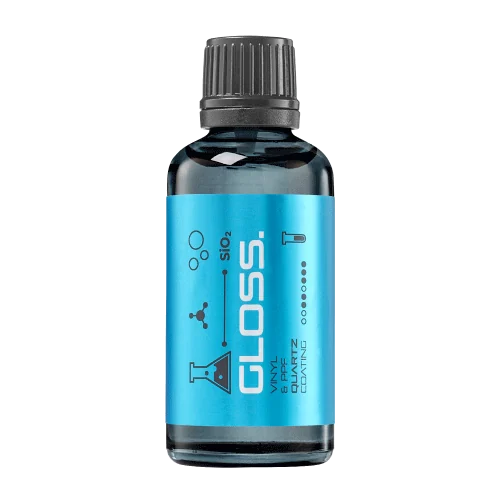 PPF & VINYLGLOSSProtection for glossy films and wraps.Discover
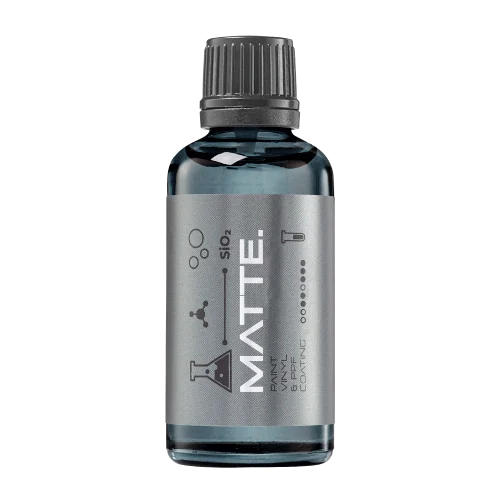 MATTE & SATINMATTEProtection that respects the finish.Discover
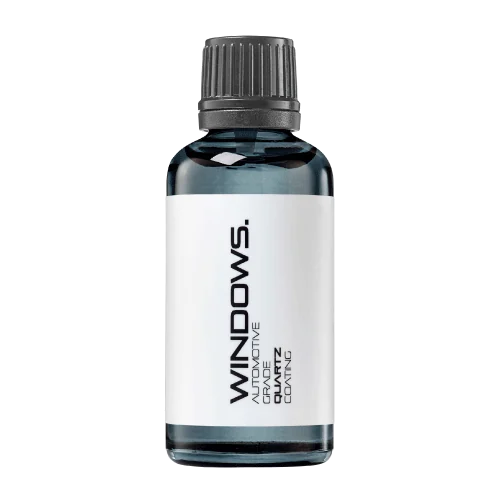 GLASSWINDOWSExplore dedicated glass protection.Discover
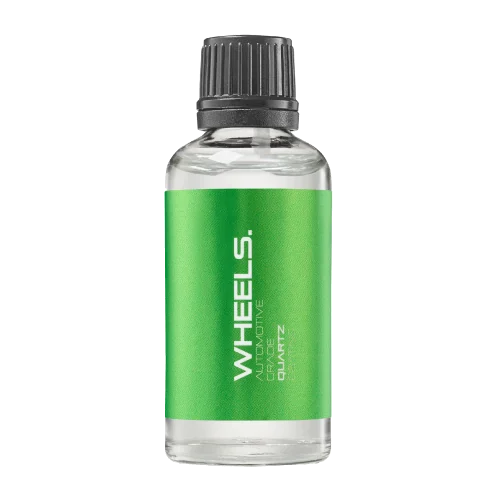 WHEEL PROTECTIONWHEELSA dedicated coating for your wheels.Discover
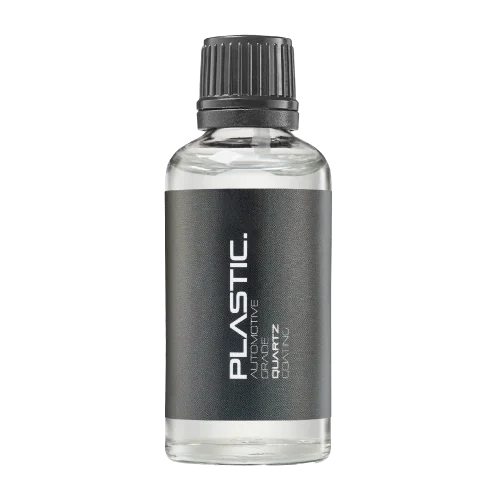 TRIM PROTECTIONPLASTICProtection for plastic surfaces.Discover
Dedicated care for the surfaces inside.
 LEATHER SURFACESLEATHERDiscover NANOLAB leather protection.Discover PLASTIC SURFACESPLASTICProtection for interior plastic surfaces.Discover TEXTILE SURFACESFABRICExplore the latest fabric formulation.Discover
Spray protection, maintenance and upcoming wash products.
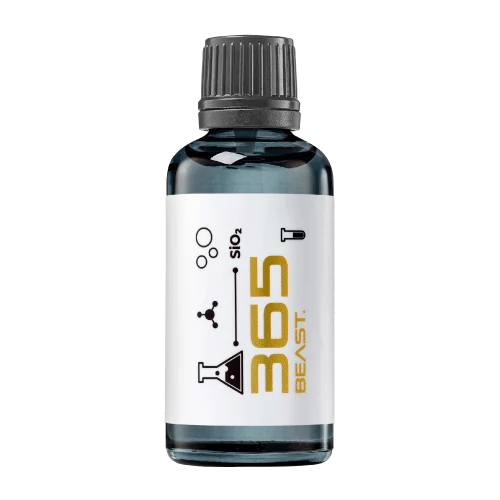 MAINTENANCEBEAST 365Explore the BEAST maintenance range.Discover
Next in washing, cleaning & care.
Ceramic protection for boats and yachts.
An easy-to-apply ceramic coating with an established track record on boats and yachts around the world.
Results vary with surface preparation, exposure and maintenance.
Read 50 MARINE guides →Explore MARINEProtection for the surfaces you live with.
A look at what we’re developing.
From cutting and one-step correction to final finishing.
A wider range for professional vehicle care.
Taking shape alongside BEAST & MATRIX.
Practical guidance for your next coating project.
Explore all guides →
A chart can make a coating comparison look decisive while hiding what the bars mean.
Updated · NANOLAB Knowledge
A chart can make a coating comparison look decisive while hiding what the bars mean. For graphene products, every displayed metric should include its unit, measurement context and interpretation.
State whether a larger or smaller number is desirable for the measured property. Avoid combining unrelated metrics into a single score unless the weighting is clearly explained. If the values come from different test methods or conditions, do not place them on one chart as though they were directly comparable.
Connect each plotted value to the product code and report. Show variation or sample count where relevant, and avoid cropping an axis merely to exaggerate a small difference. A customer should be able to distinguish a measured result from a schematic illustration or an invented example.
A clear chart reduces the reader’s work. It should explain the finished coating’s evidence, not use the graphene name and a dramatic graphic to make an undefined advantage appear scientific.
Explore MATRIX GRAPHENE P503G or ask NANOLAB about the exact formula for your application.