


A full polishing range.
From cutting and one-step correction to final finishing.
Specialist chemistry. Expert application.
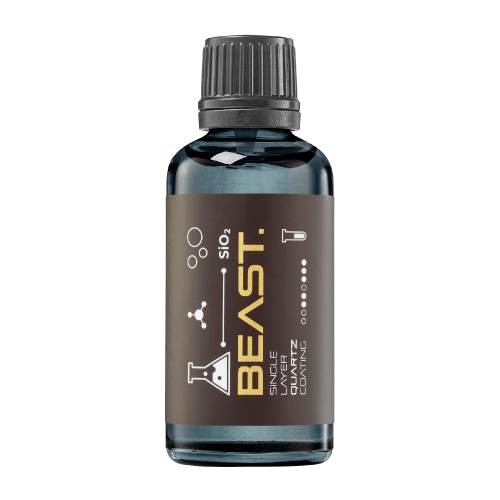
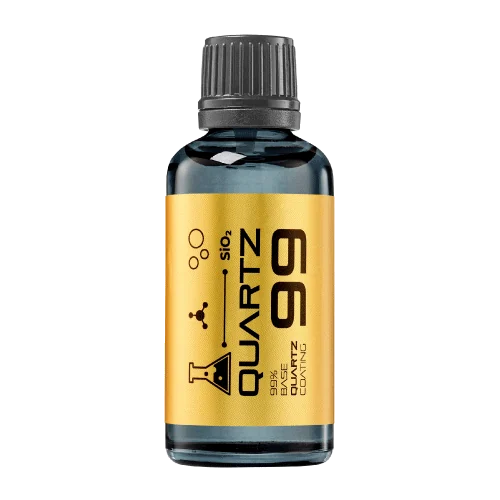 QUARTZ99 / CERAMIC BASE COAT
The foundation of your coating system.
A layerable quartz base coat designed for mechanical protection. Pair it with a suitable top coat to create the final finish.
For application by NANOLAB certified installers only.
Four formulas. Extended working time. Find the coating for your finish.
Explore the BEAST family of ceramic coatings.
Find the coating for each exterior surface.
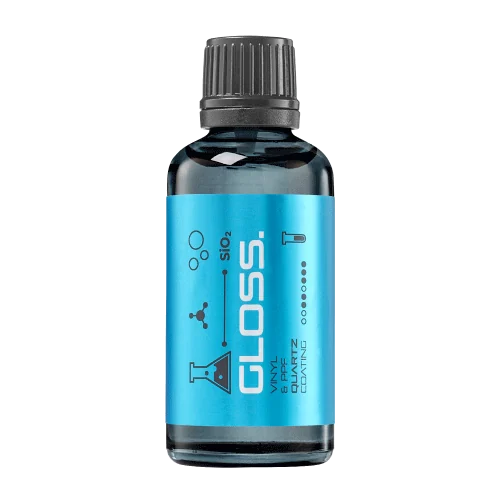 PPF & VINYLGLOSSProtection for glossy films and wraps.Discover
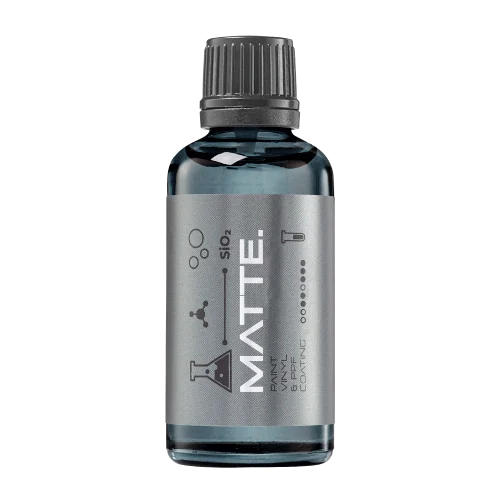 MATTE & SATINMATTEProtection that respects the finish.Discover
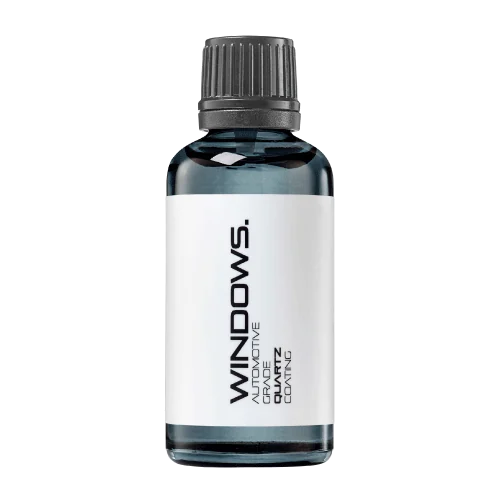 GLASSWINDOWSExplore dedicated glass protection.Discover
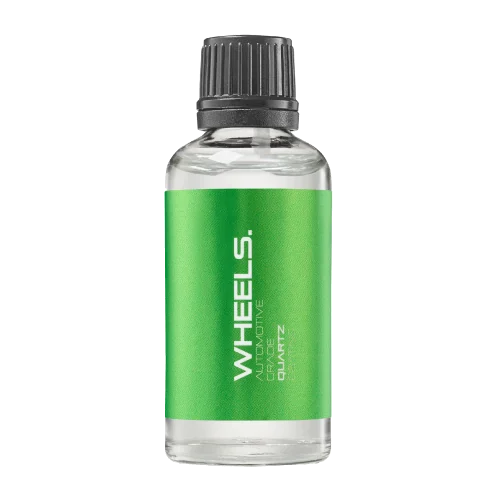 WHEEL PROTECTIONWHEELSA dedicated coating for your wheels.Discover
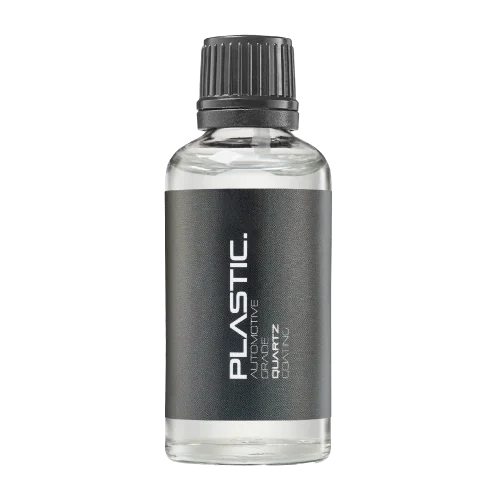 TRIM PROTECTIONPLASTICProtection for plastic surfaces.Discover
Dedicated care for the surfaces inside.
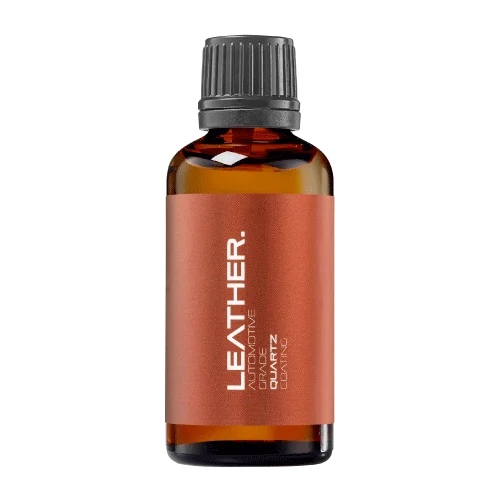 LEATHER SURFACESLEATHERDiscover NANOLAB leather protection.Discover PLASTIC SURFACESPLASTICProtection for interior plastic surfaces.Discover TEXTILE SURFACESFABRICExplore the latest fabric formulation.Discover
Spray protection, maintenance and upcoming wash products.
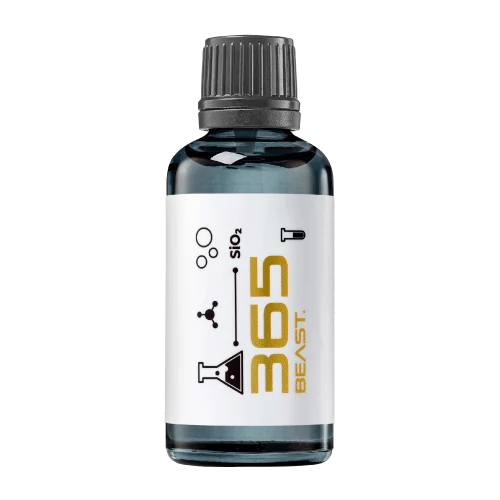 MAINTENANCEBEAST 365Explore the BEAST maintenance range.Discover
Next in washing, cleaning & care.
Ceramic protection for boats and yachts.
An easy-to-apply ceramic coating with an established track record on boats and yachts around the world.
Results vary with surface preparation, exposure and maintenance.
Read 50 MARINE guides →Explore MARINEProtection for the surfaces you live with.
A look at what we’re developing.
From cutting and one-step correction to final finishing.
A wider range for professional vehicle care.
Taking shape alongside BEAST & MATRIX.
Practical guidance for your next coating project.
Explore all guides →
Report coating results by meaningful surface zones and affected area so a strong overall average does not conceal a recurring local weakness.
Updated · NANOLAB Knowledge

An average result can be mathematically correct and operationally misleading. If most of a coated surface performs well while one critical area repeatedly collects residue or shows poor finish, averaging everything together may hide the problem the customer actually notices.
Choose zones based on meaningful differences in geometry, use or exposure: horizontal and vertical panels, direct-spray and sheltered glass, frequently handled areas or regions near fittings. Avoid drawing boundaries after the result appears. Record the physical area and the inspection question for each zone.
A critical zone may deserve a separate acceptance criterion even when it occupies little area. For example, an optical viewing region should not pass solely because a large surrounding decorative border performs well.
| Summary | What it answers | Possible limitation |
|---|---|---|
| Average of zone scores | Typical score among defined zones | Small and large zones receive equal weight |
| Area-weighted average | Average relative to physical area | A small critical region may still be obscured |
| Worst-zone result | Most severe observed local condition | Does not describe how widespread it is |
| Affected area plus severity | Extent and seriousness together | Requires consistent mapping and scoring |
Suppose an illustrative surface has nine equally sized zones rated 5 and one zone rated 1 on an internal ordinal scale. The arithmetic mean is 4.6, but that number does not erase the poor zone. Also, an ordinal score is not automatically a measurement with equal physical intervals, so averaging it should be justified rather than treated as an unquestionable performance quantity.
Report the distribution and the actual observations behind the ratings. “One zone retained visible residue after the defined cleaning sequence” tells the reviewer something an unexplained 4.6 does not.
Compare the same mapped region across visits and comparable parts. If weakness follows a location, investigate geometry, application access, runoff, handling and preparation. If it follows a batch across several locations, investigate the batch and process records. Neither pattern alone proves a cause, but each suggests a useful next check.
Do not treat multiple observations of one zone as independent surfaces. Retain part identity, zone identity and visit date so the analysis reflects the actual structure of the evidence.
A project can require an acceptable overall result and no unacceptable condition in critical zones. Agree those rules in advance, along with the handling of inaccessible or unmeasured areas. Missing data should not quietly become a pass.
Include a marked photograph or drawing, the zone results and the next action. The purpose is to locate and correct a practical weakness, not simply to produce a better average. A transparent zone report can support targeted process improvement while preserving evidence of the areas that already work well.
Discuss your surface and intended use with NANOLAB. Follow the current instructions for the exact product when planning application and care.
A ranking can imply a meaningful separation even when the measured difference is small relative to variability or uncertainty.
Keep dry storage and active exposure separate in a coating durability record when a trial pauses for transport, weather or equipment downtime.

 A Supplier Changes the Coating Bottle: Requalify the Dispensing Workflow